Screen Name
|
Financial Report - Báo cáo tài chính cuối ca
|
Open Link
|
Log in – Select Outlet - Report - Financial Report
|
Summary
|
|
The screen allows to view/print Financial Report |
Screen
|
|
Fields Description
|
|
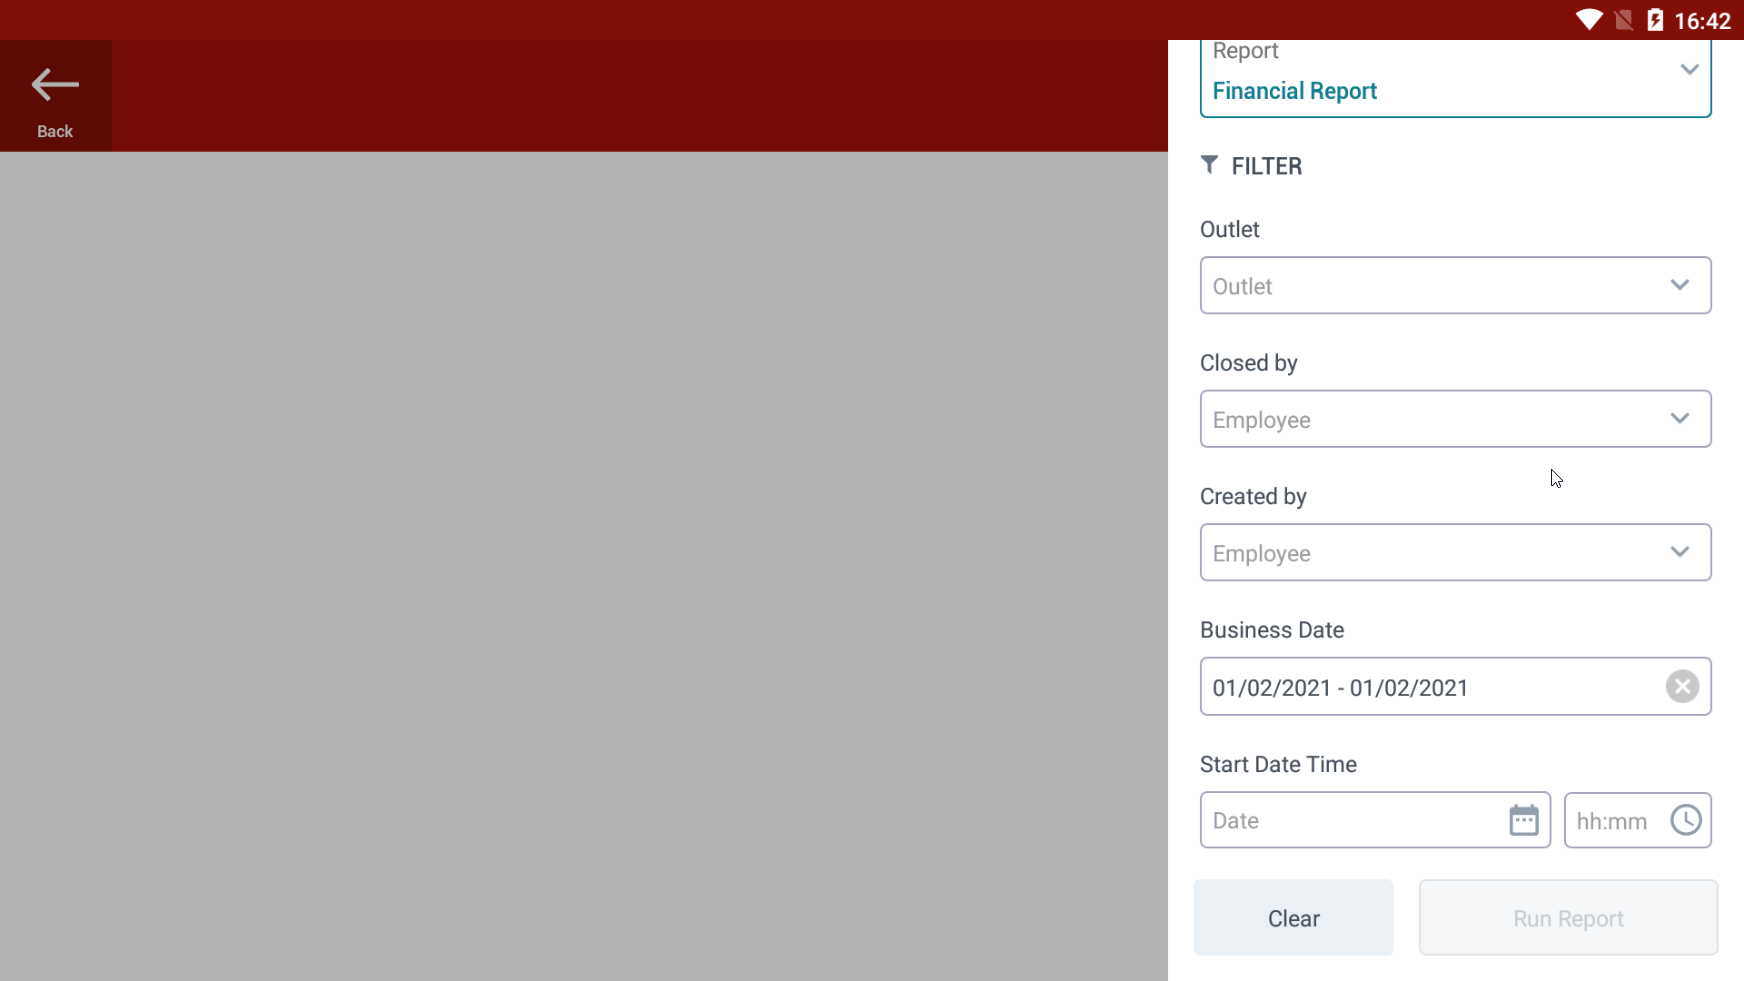
Filters Description: Outlet: Select outlet Employee: Select cashier Business Date: Select date range Start Date Time: Select Start Date Time (system date) End Date Time: Select end date time (system date) Overview Statistical Table:
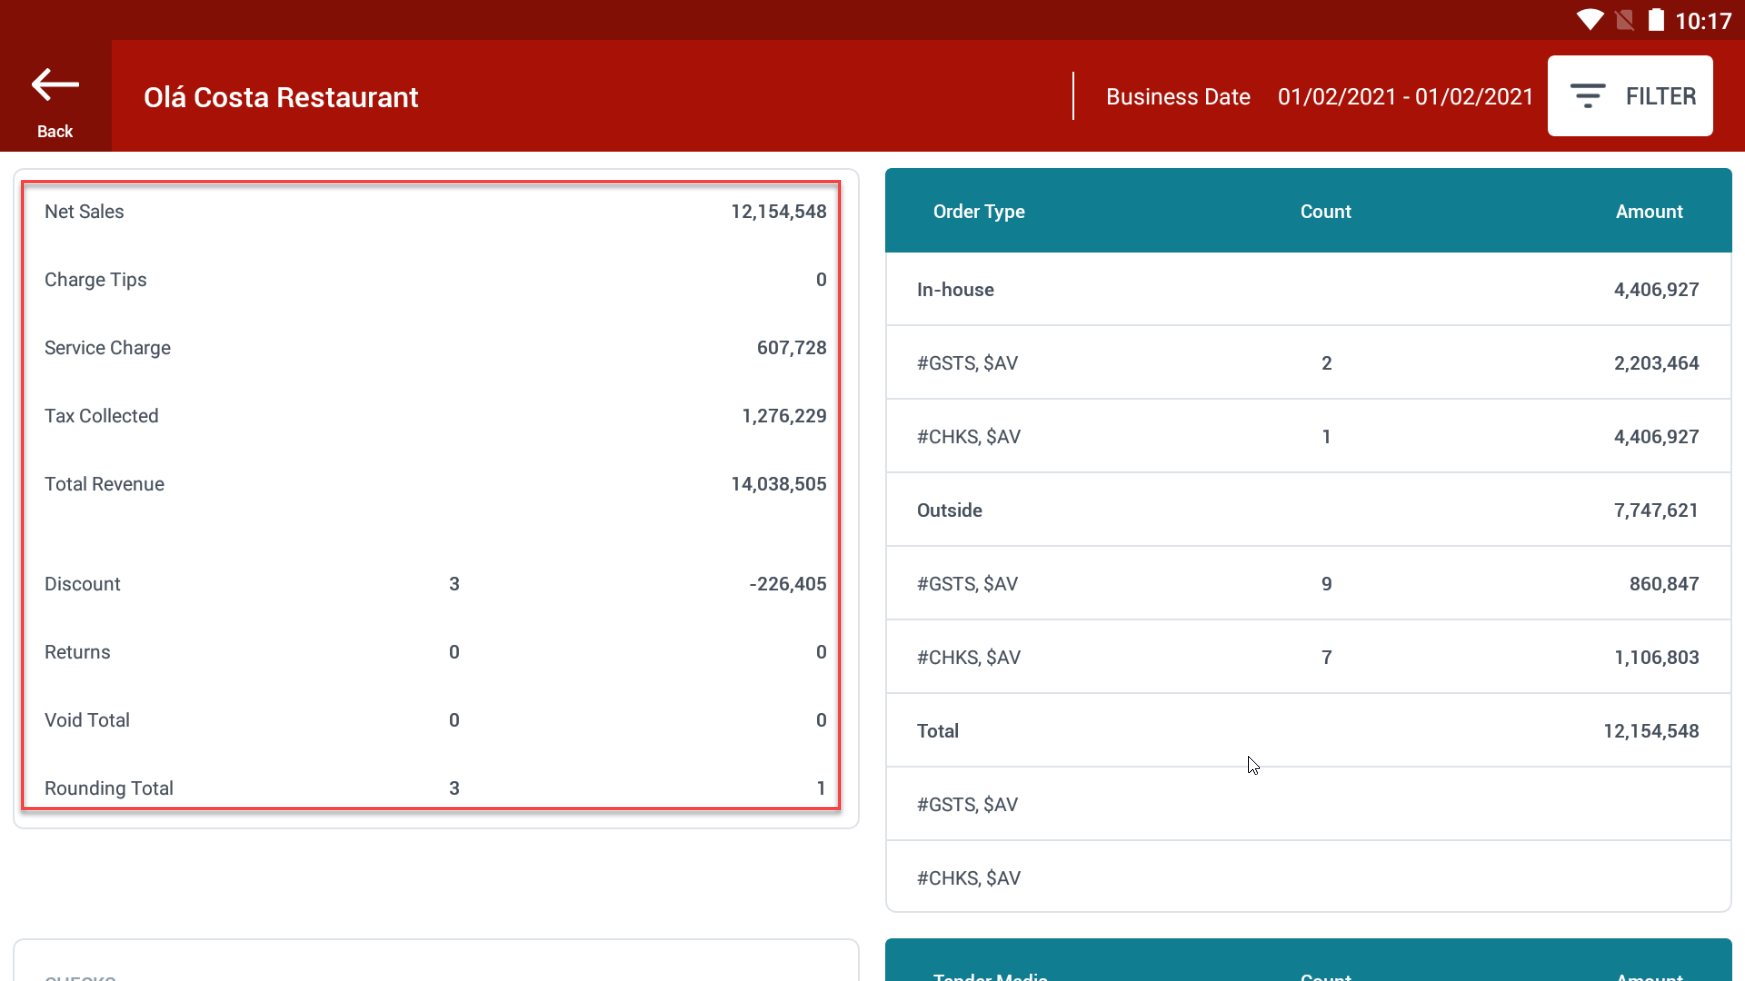
Net Sales: Revenue before taxes, fees Charge Tips: Total tips amount Service Charge: Total service charge fee Tax Collected: Total tax amount Total Revenue: Revenue after taxes, fees Discount: Total discount Return: total return amount Void Total: total void amount Rounding Total: total rounding amount Guest Statistical Table: 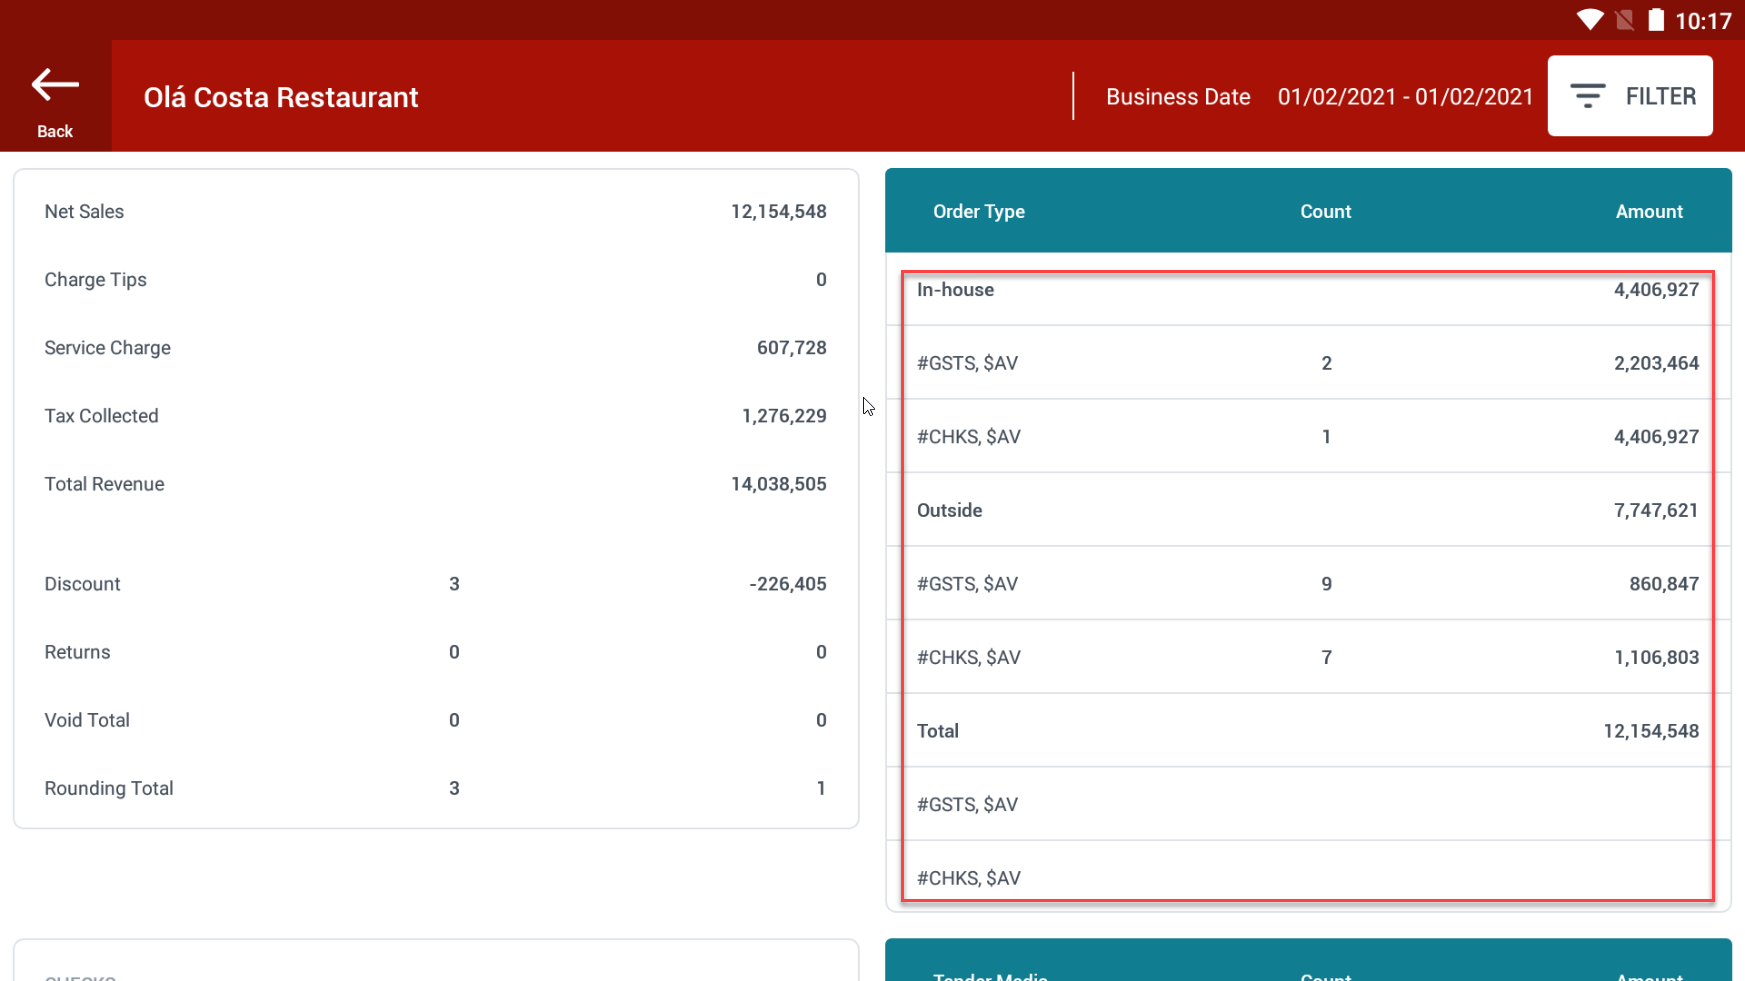
In-house: In-house guest statistics
Outside: Outside guest statistics
Total:
Opening/Closing shift Statistical table: 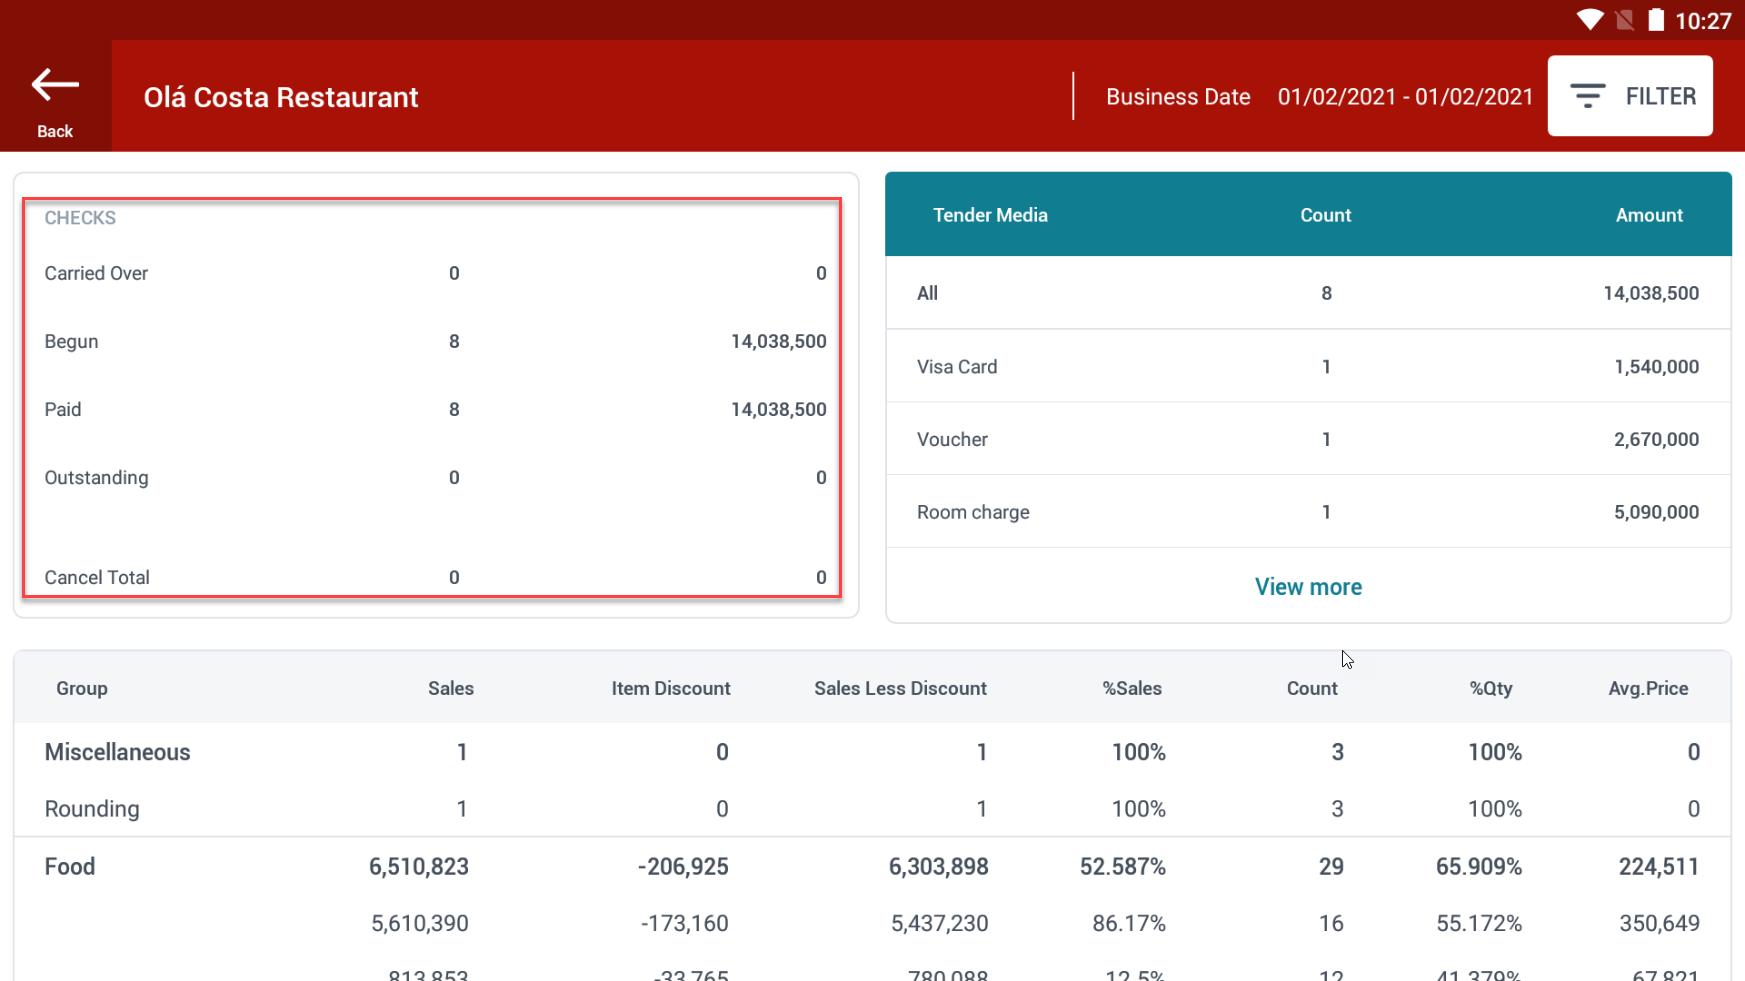
Carried Over: Total bill bring over this shift. Begun: Total bills and total amount at opening shift. Paid: Total paid bills/amount. Outstanding: Total not completed bills/amount. Cancel Total: Tổng canceled bills/amount. Payment Statistical table: 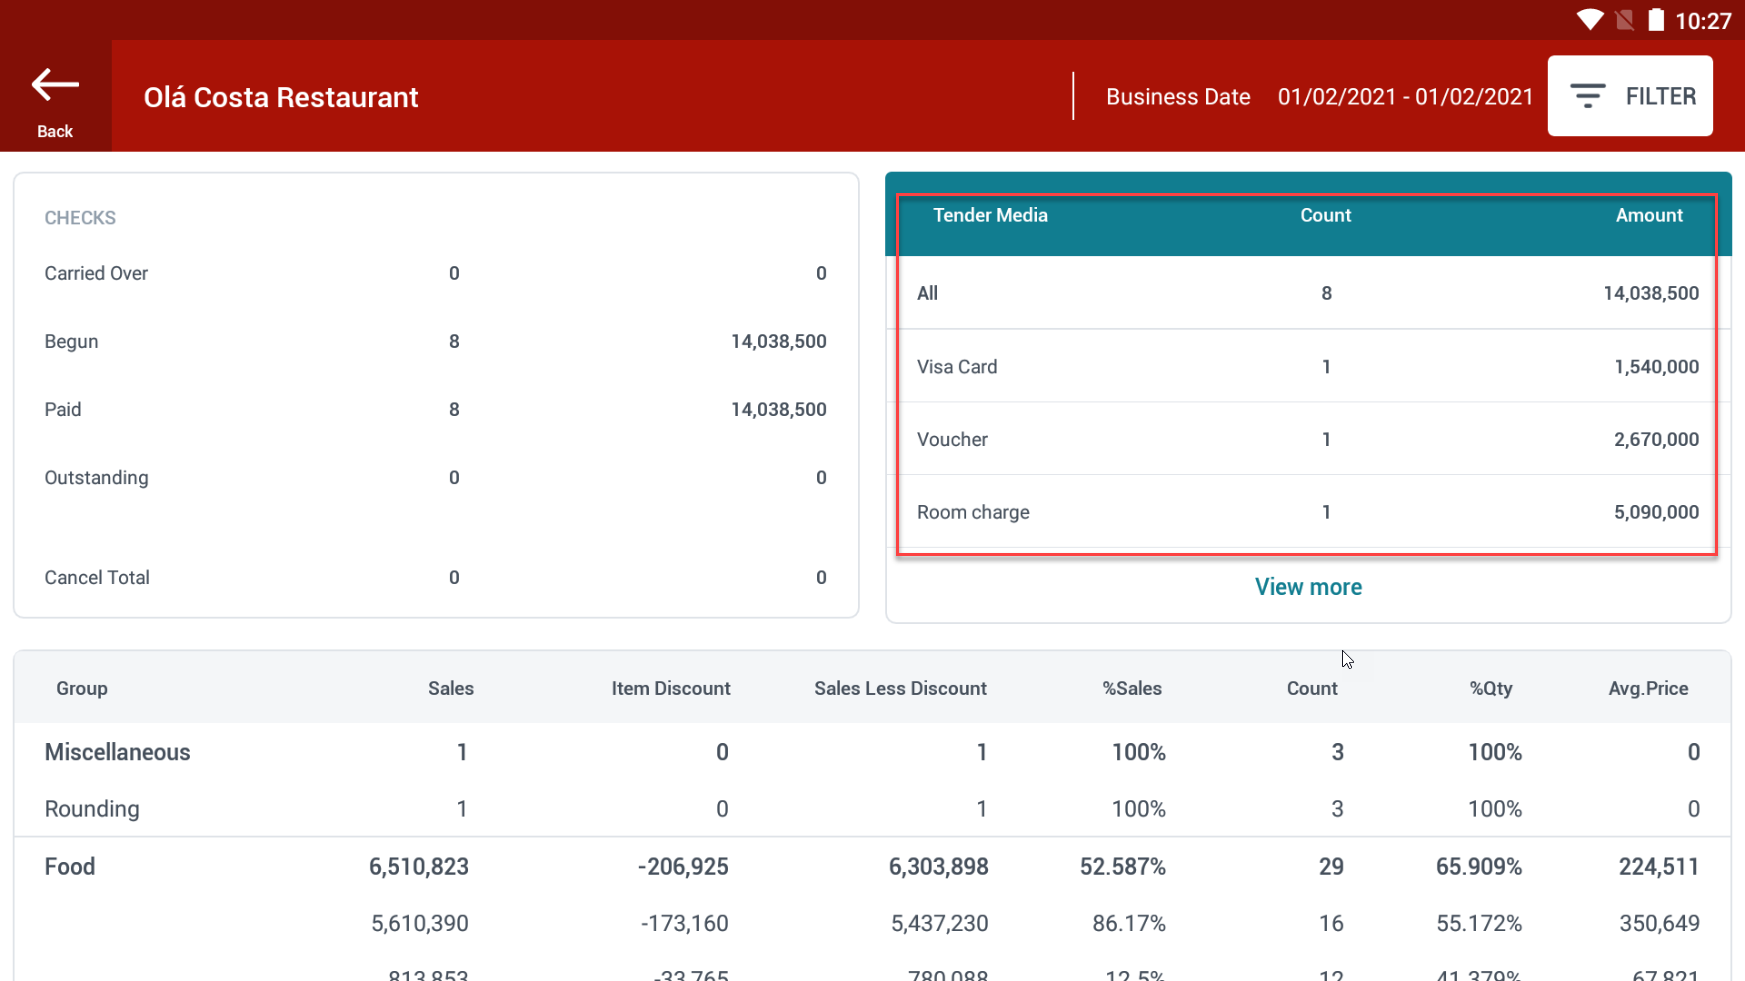
Tender Media: payment method Count: Total paid bills Amount: total paid amount Revenue by items statistical table: 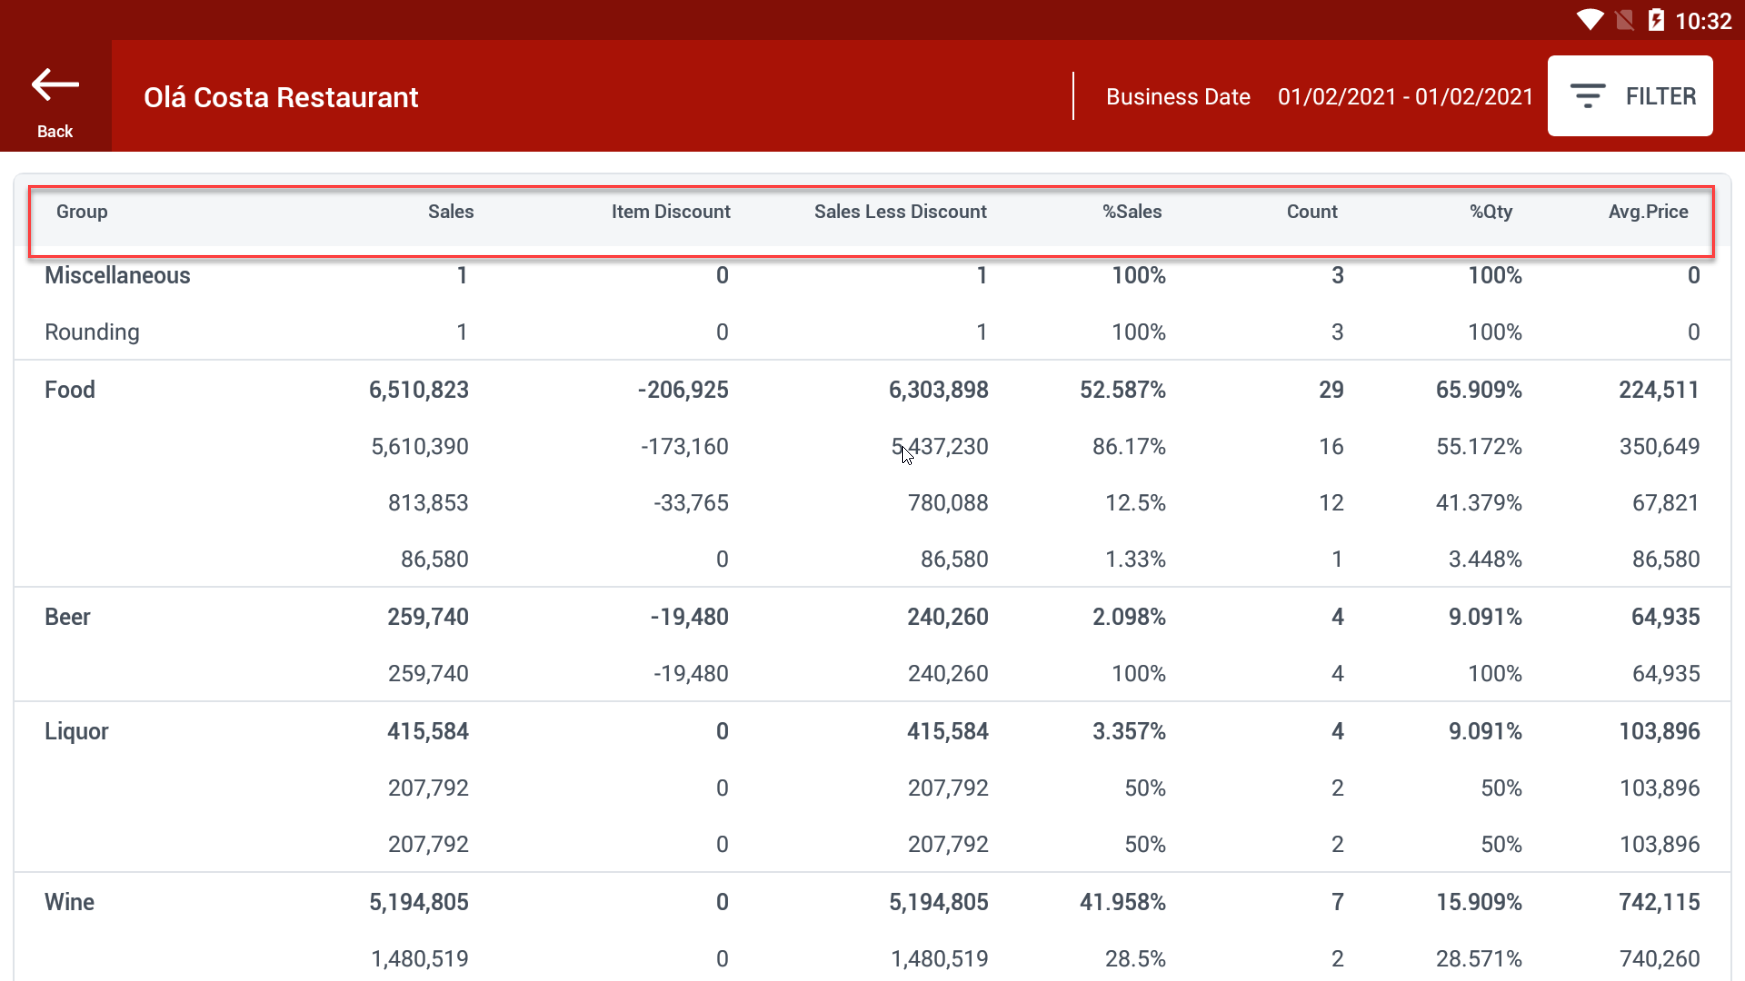
Group: Name of item group. Sales: Revenue before discount. Item Discount: Discount amount. Sale Less Discount: Revenue after discount. %Sales: Percentage of sold items by revenue. Count: Count of sold items. %Qty: Percentage of sold items by quantity. Avg.Price: Average item price. Top selling item statistical table: 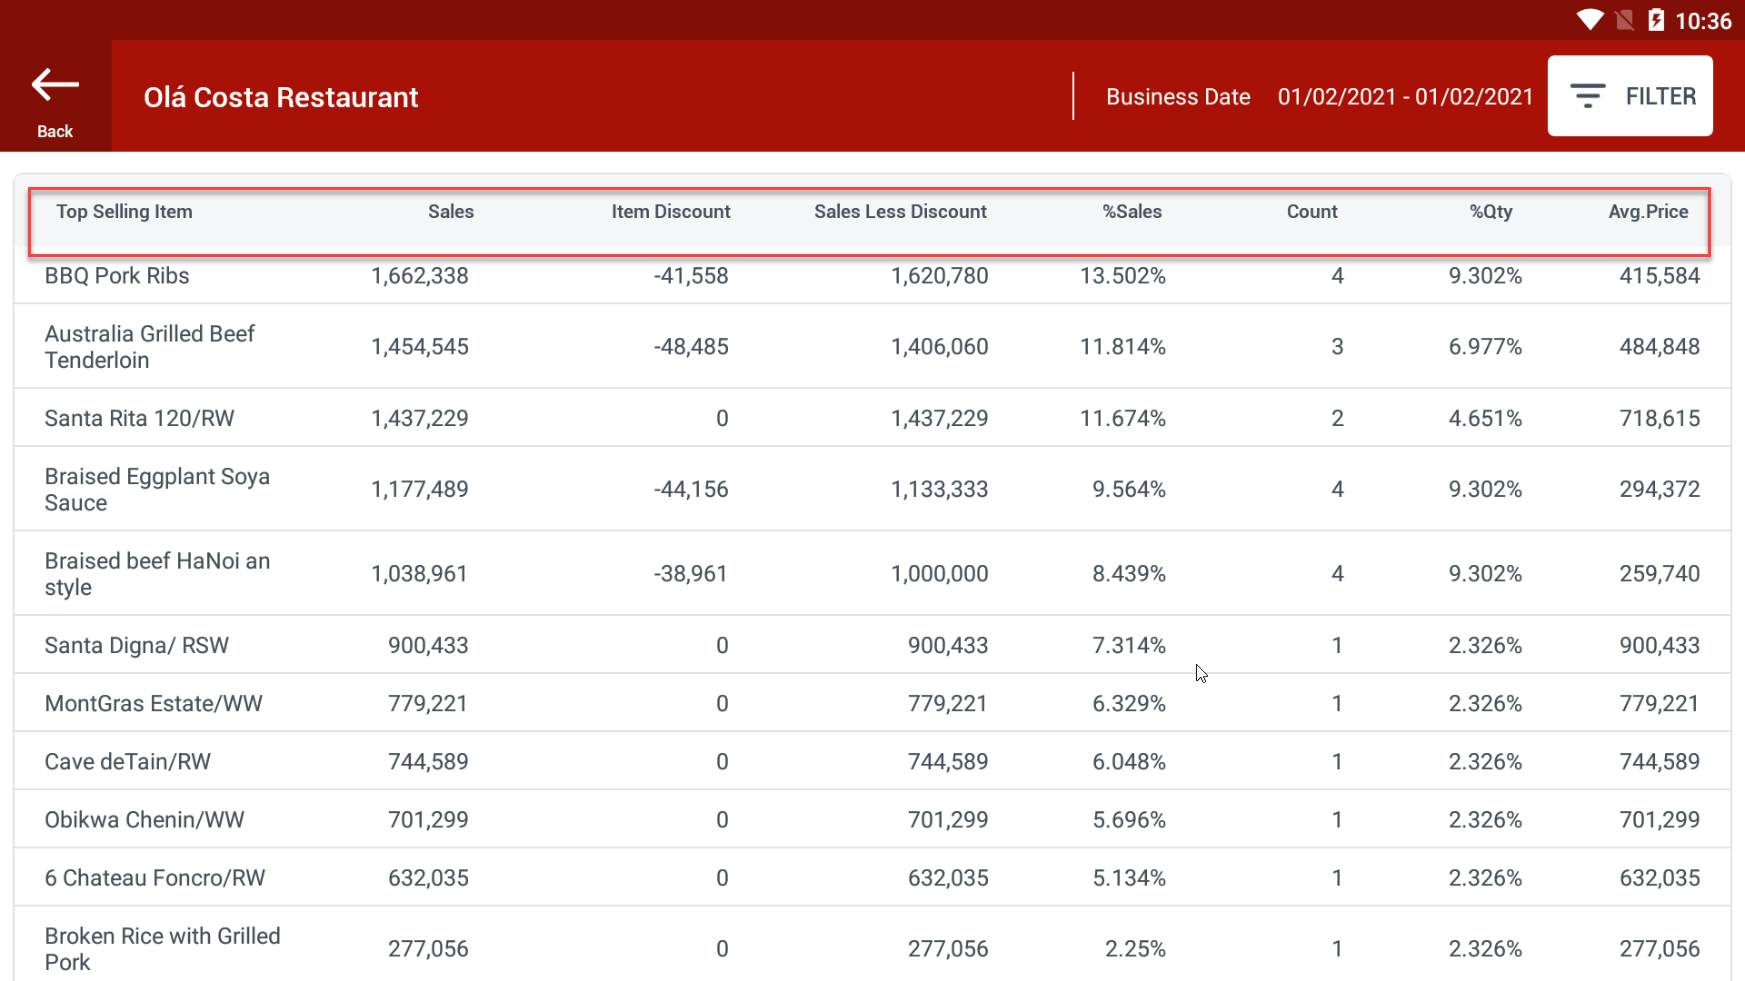
Top Selling Item: Top selling item name Sales: Revenue before discount. Item Discount: Discount amount. Sale Less Discount: Revenue after discount. %Sales: Percentage of sold items by revenue. Count: Count of sold items. %Qty: Percentage of sold items by quantity. Avg.Price: Average item price. Discount statistical table: 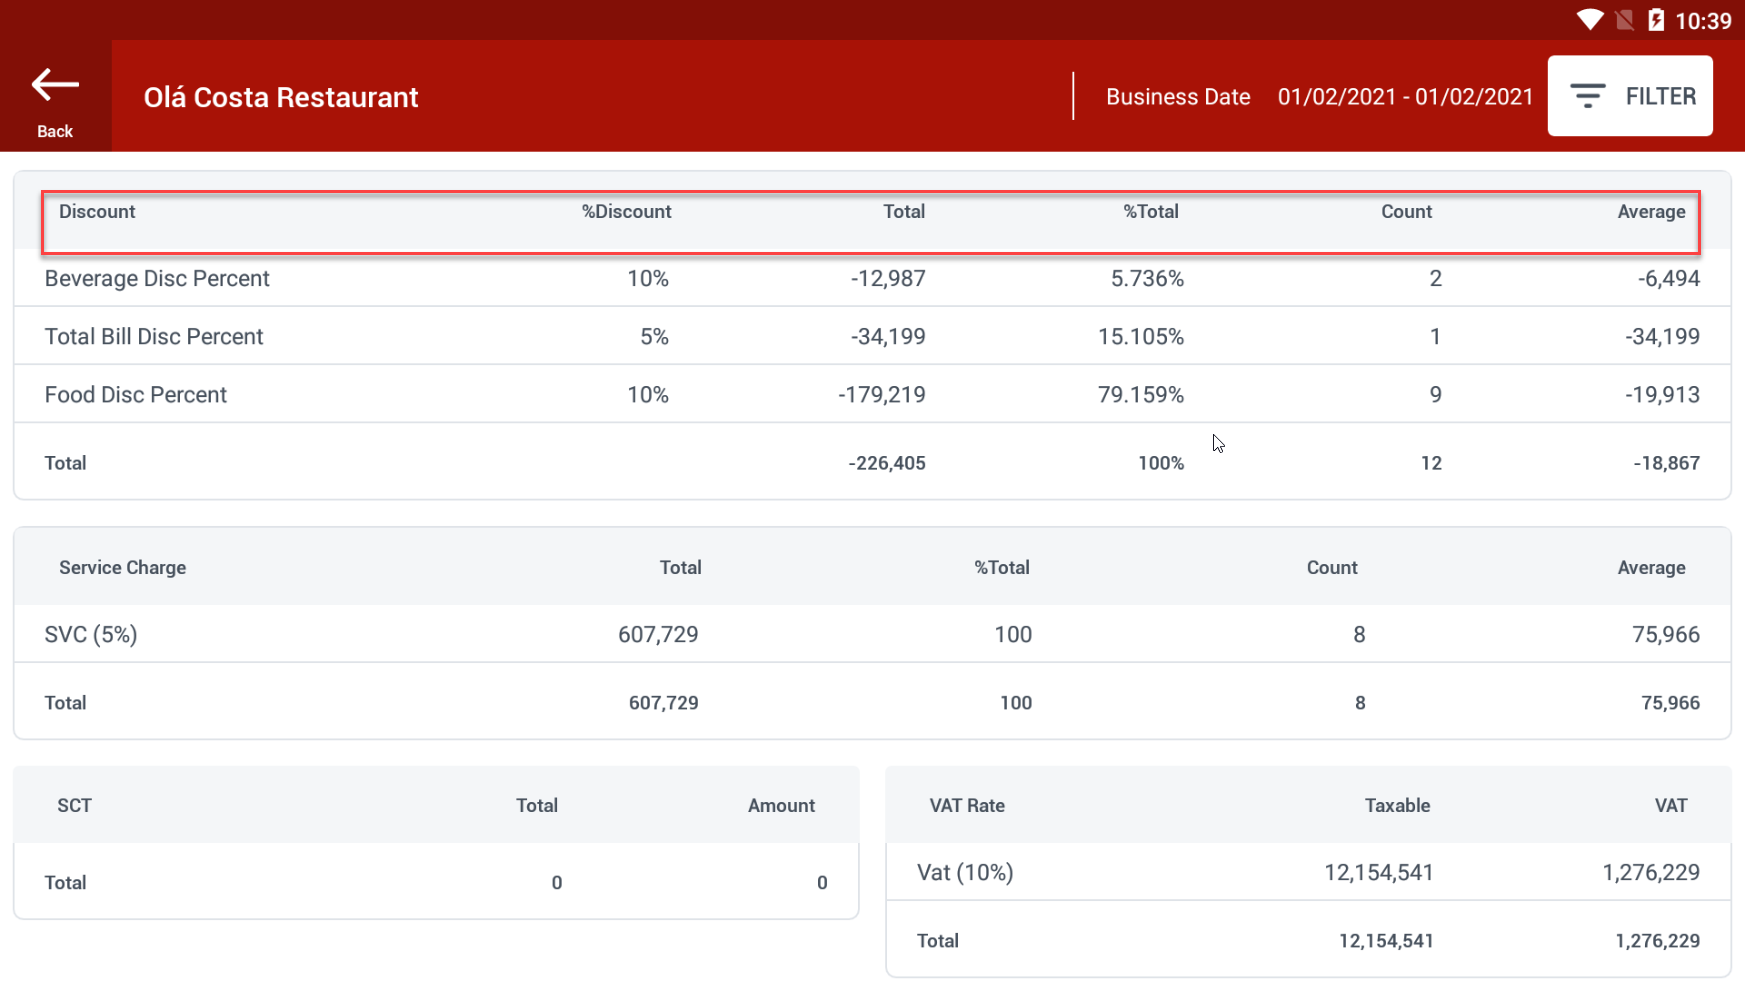
Discount: Discount type %Discount: Percentage of discount type Total: Discount amount %Total: Percentage of total amount Count: Number of discount time Average: Average discount amount. Service Charge statistical table: 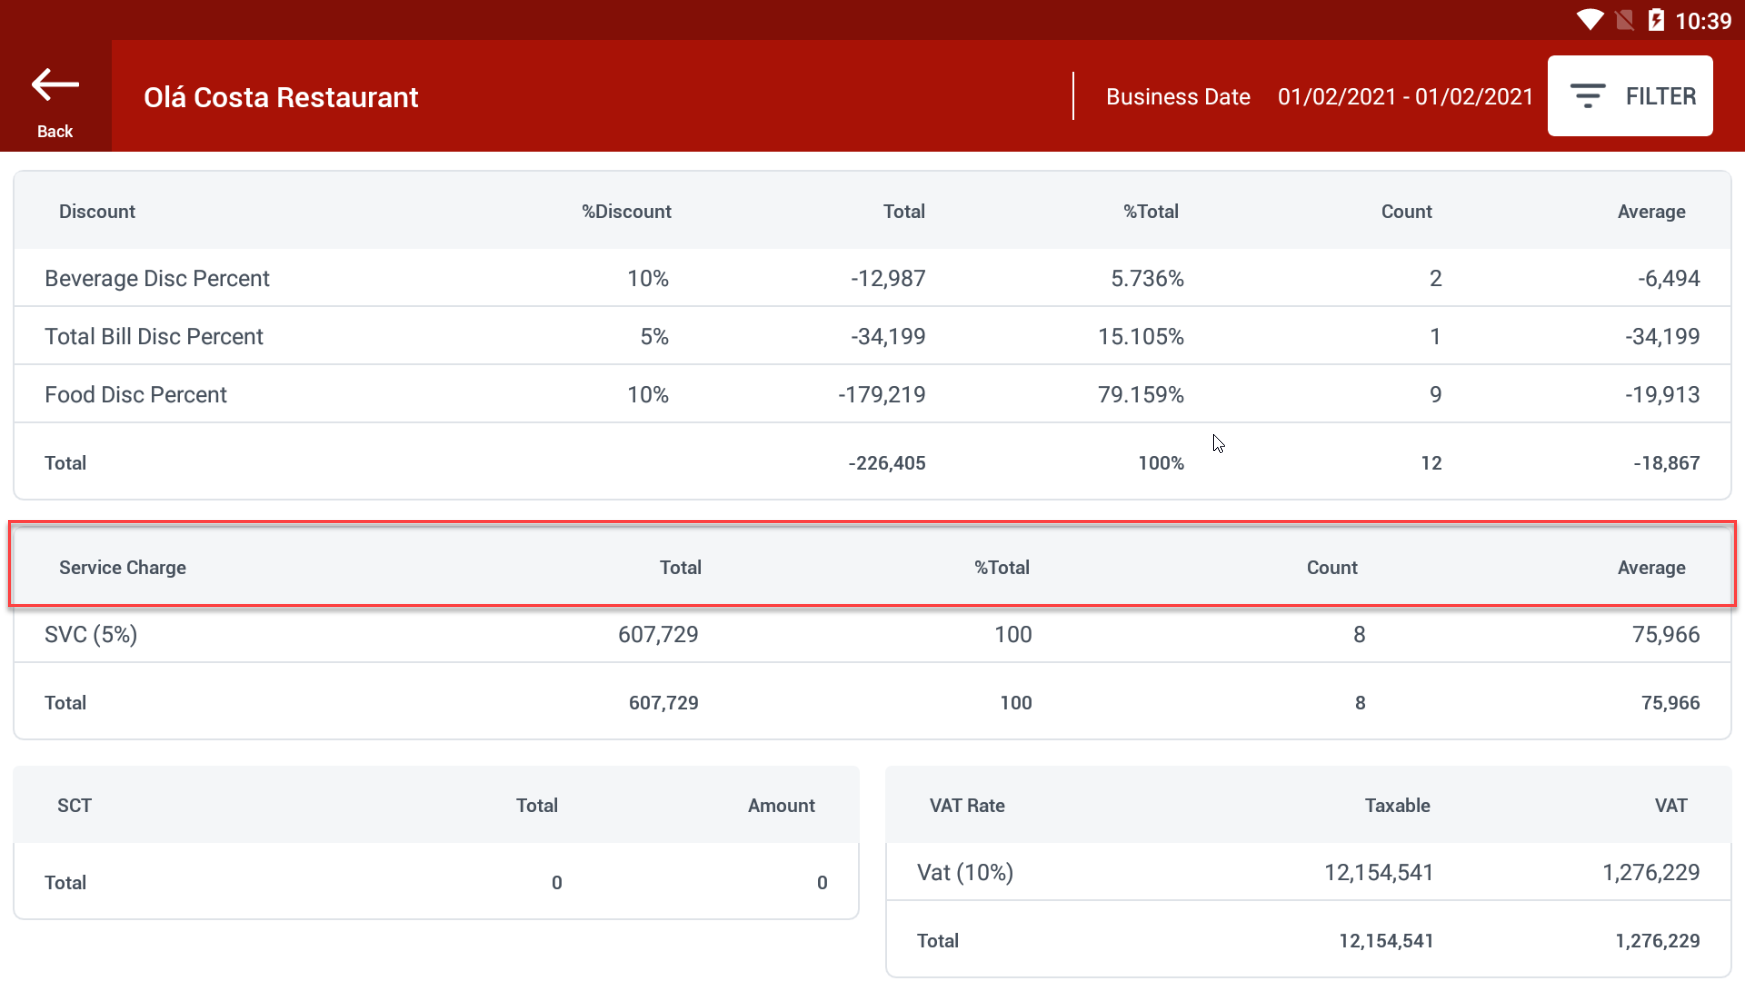
Service Charge: name of service Total: service charge amount. %Total: Percentage of total amount Count: Number of discount time Average: Average discount amount. Special Consumption tax (SCT) statistical table: 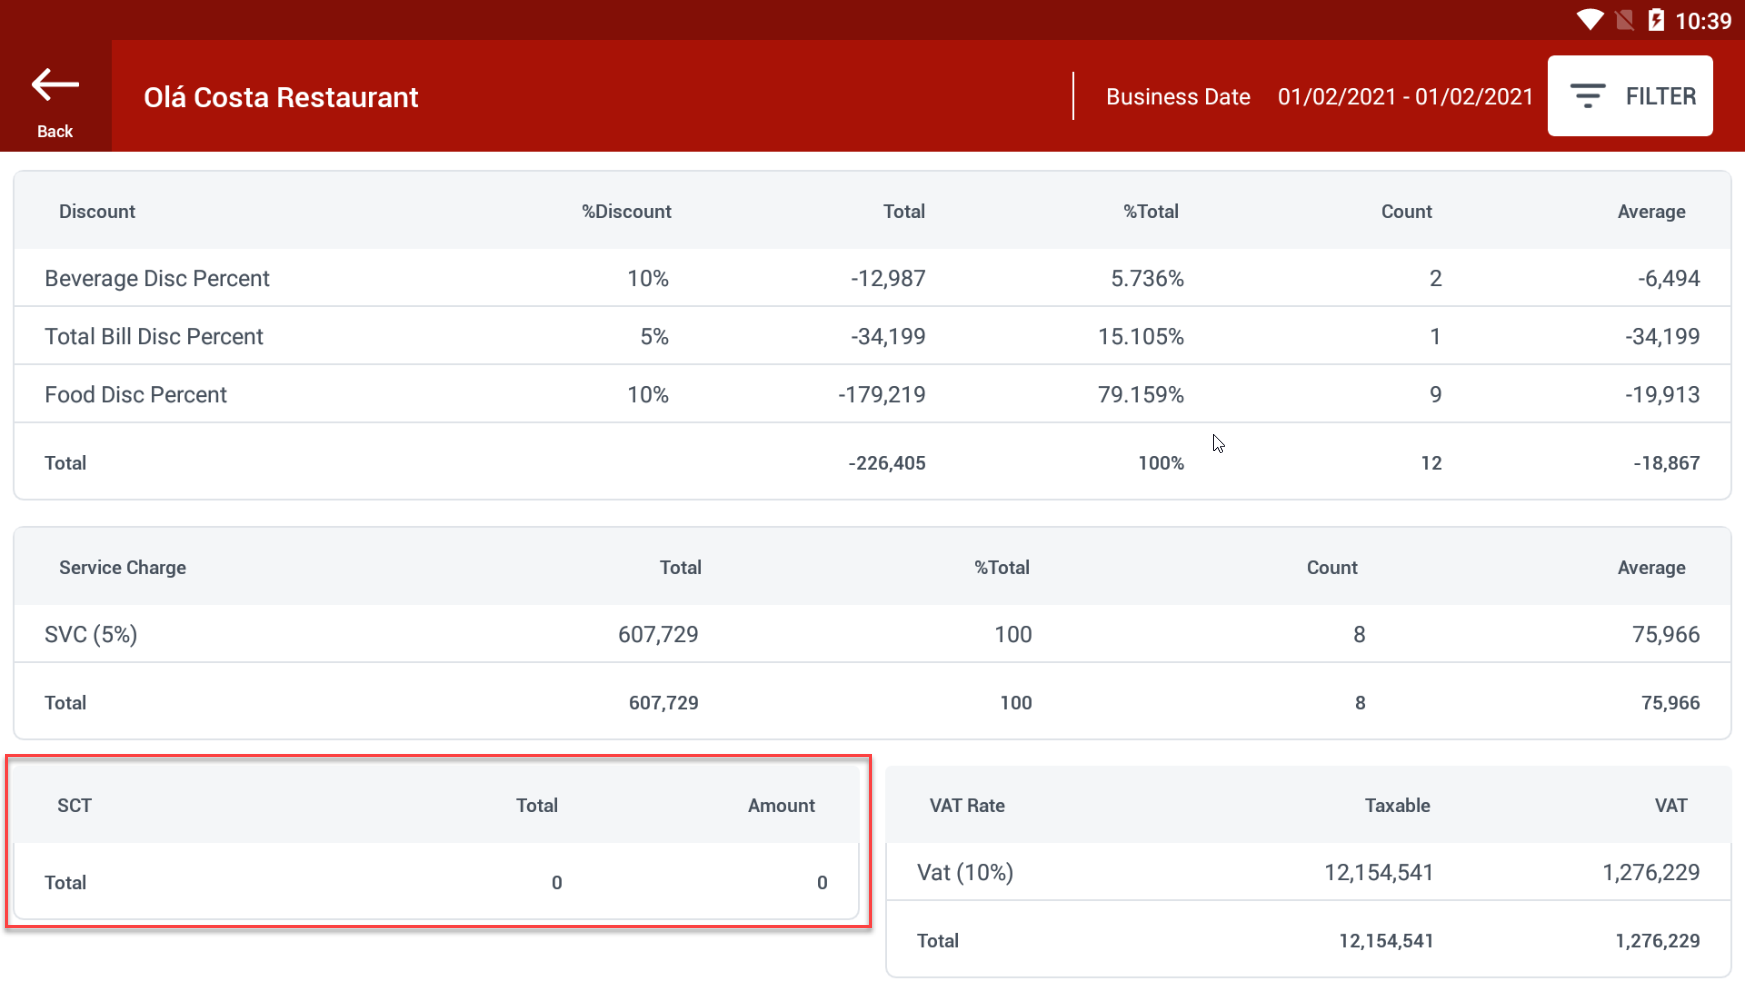
SCT: name of SCT Total: Total SCT bills Amount: Total SCT amount Value Added tax (VAT) statistical table: 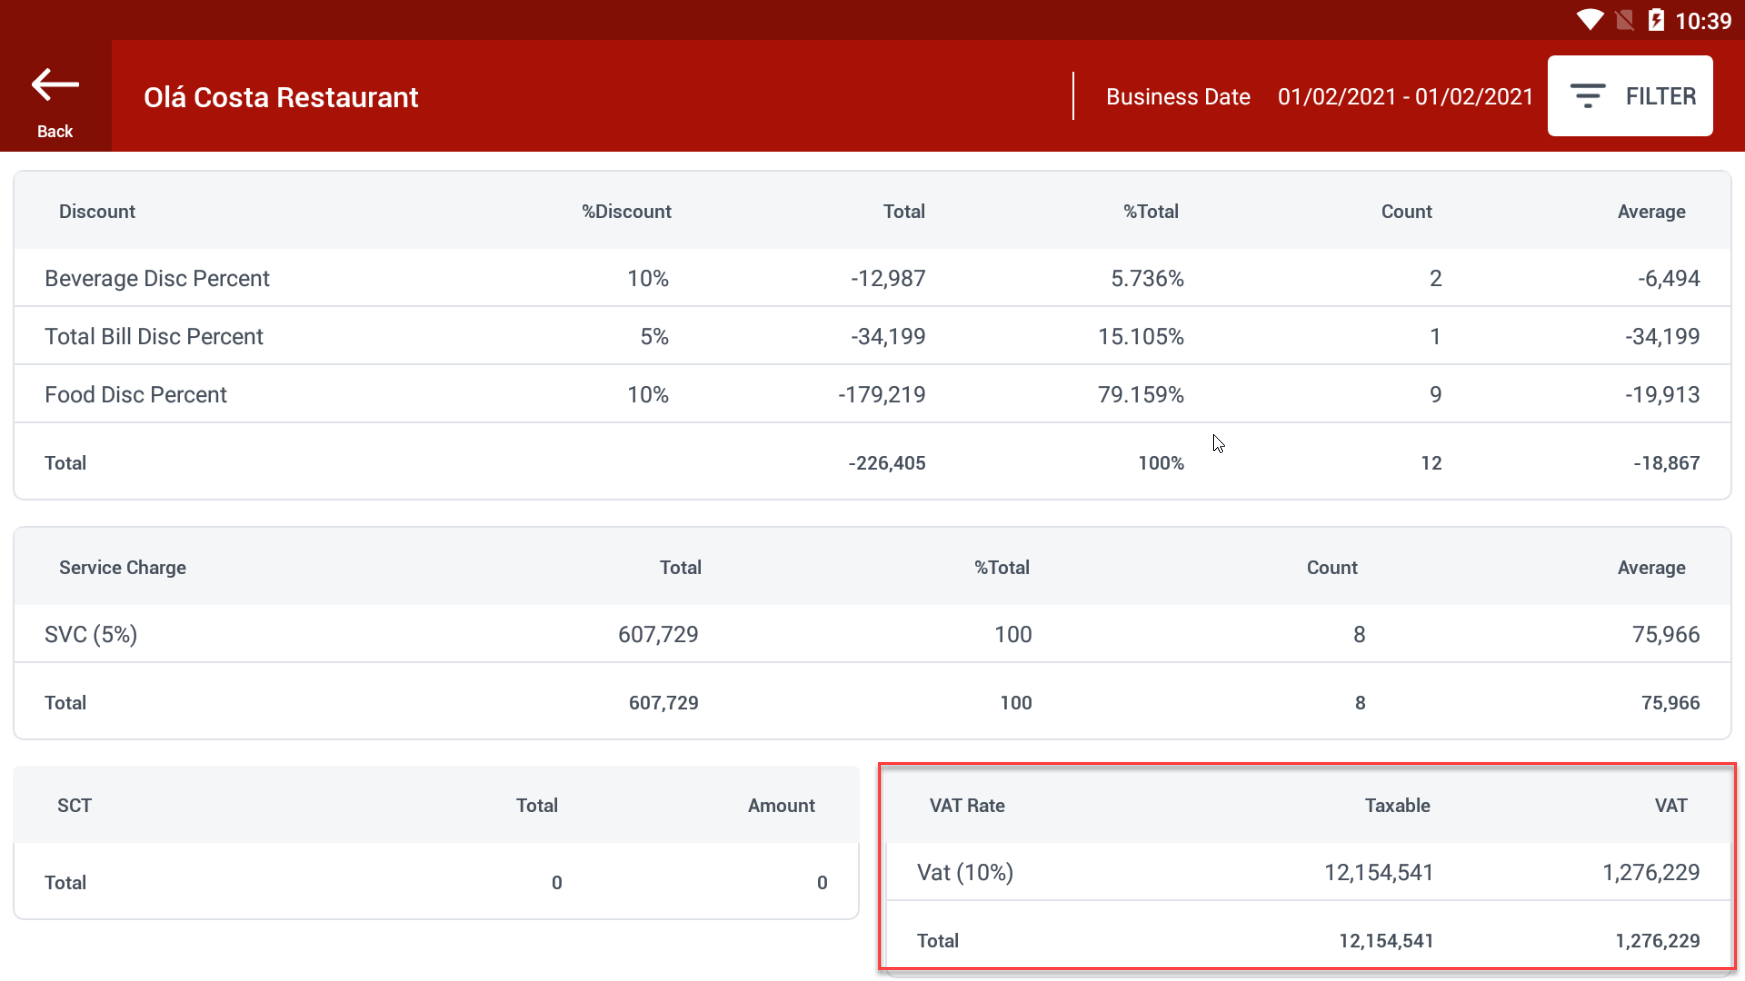
VAT Rate: Rate of VAT Taxable: Total taxable amount VAT: Total tax amount

Click this icon to print report |
Remarks
|
|