[Eng] Report & Analysis
Screen Name |
Report & Analysis |
Open Link |
Log in – CRS – Report - Report & Analysis |
Summary |
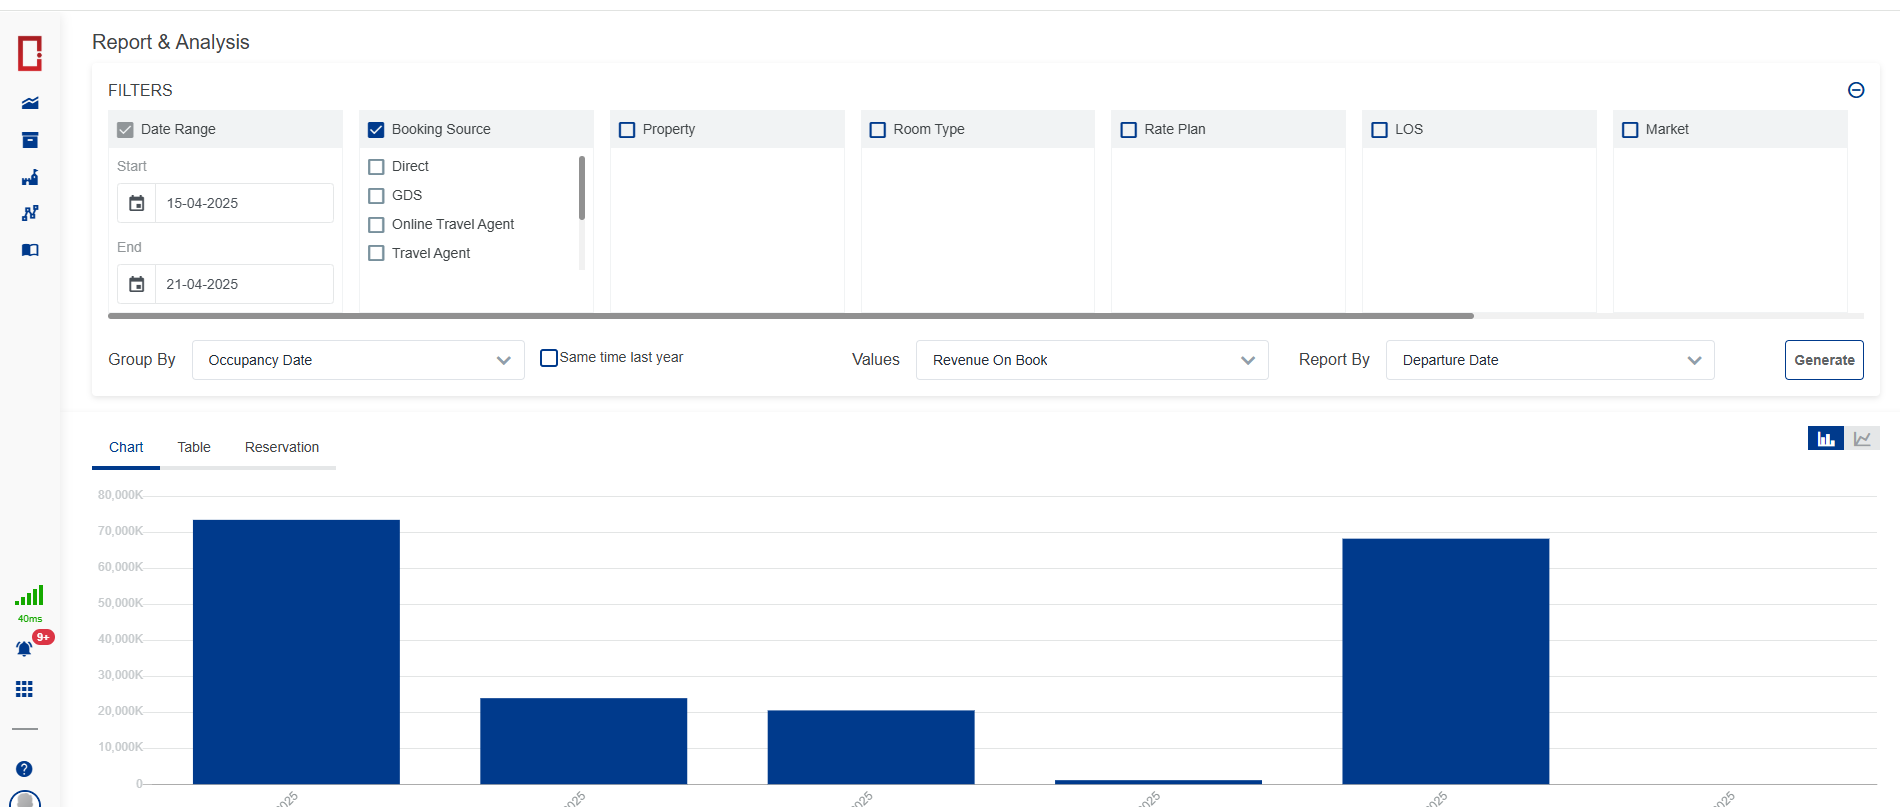
This interface allows users to generate revenue reports and analyze data based on various criteria such as stay dates, departure dates, booking sources, room types, and more. |
Screen |
 |
Fields Description |
1. Filters:a. Date Range – the time period for querying data (default: the last 7 days)
b. Other Optional Filters:
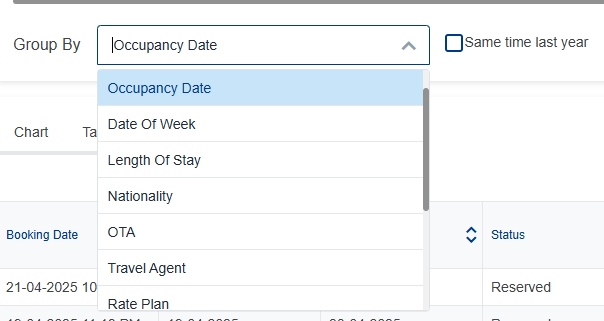
📌 Users can check the boxes to enable any filters based on their analysis needs. 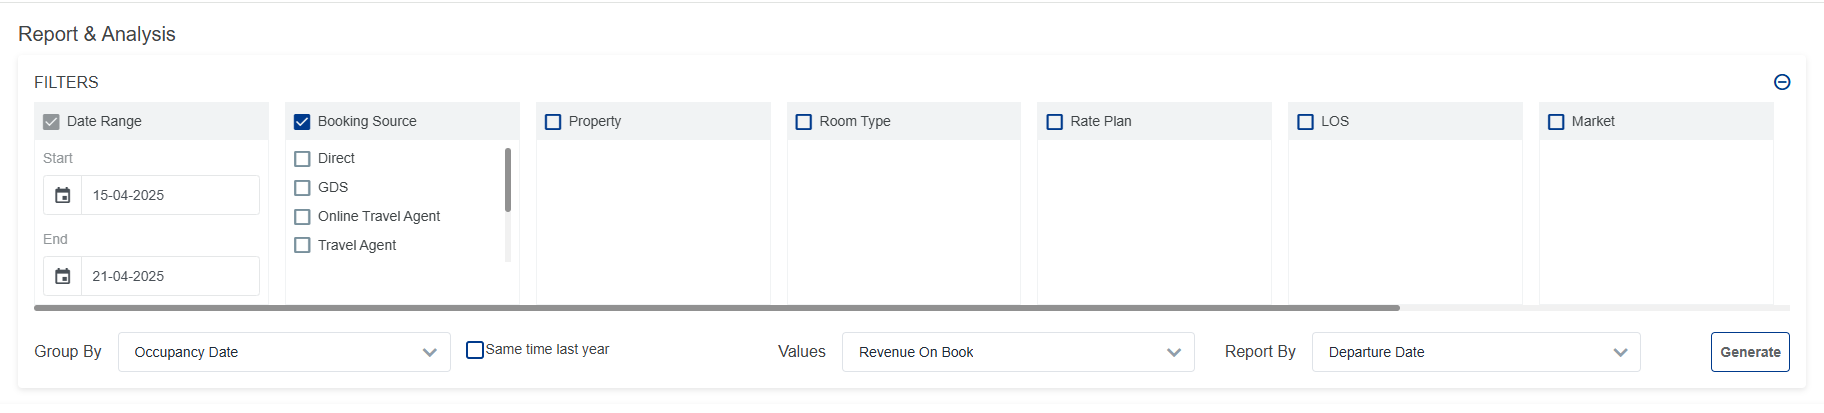 2. Setup for Grouping and Display Metrics:a. Group By:You can group data by various dimensions such as:
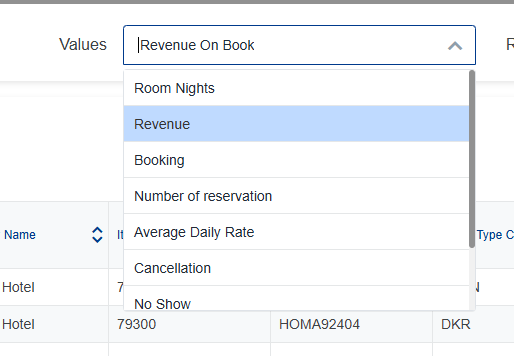
b. Compare with Same Time Last Year:Tick this option to compare data with the same period from the previous year. 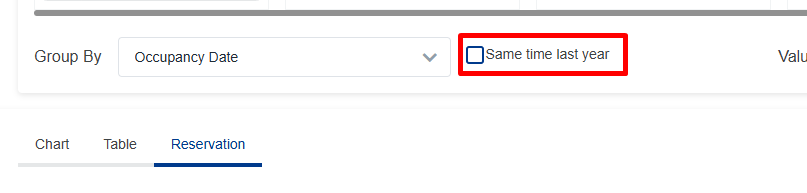 c. Displayed Values:Choose what metrics to display, such as:
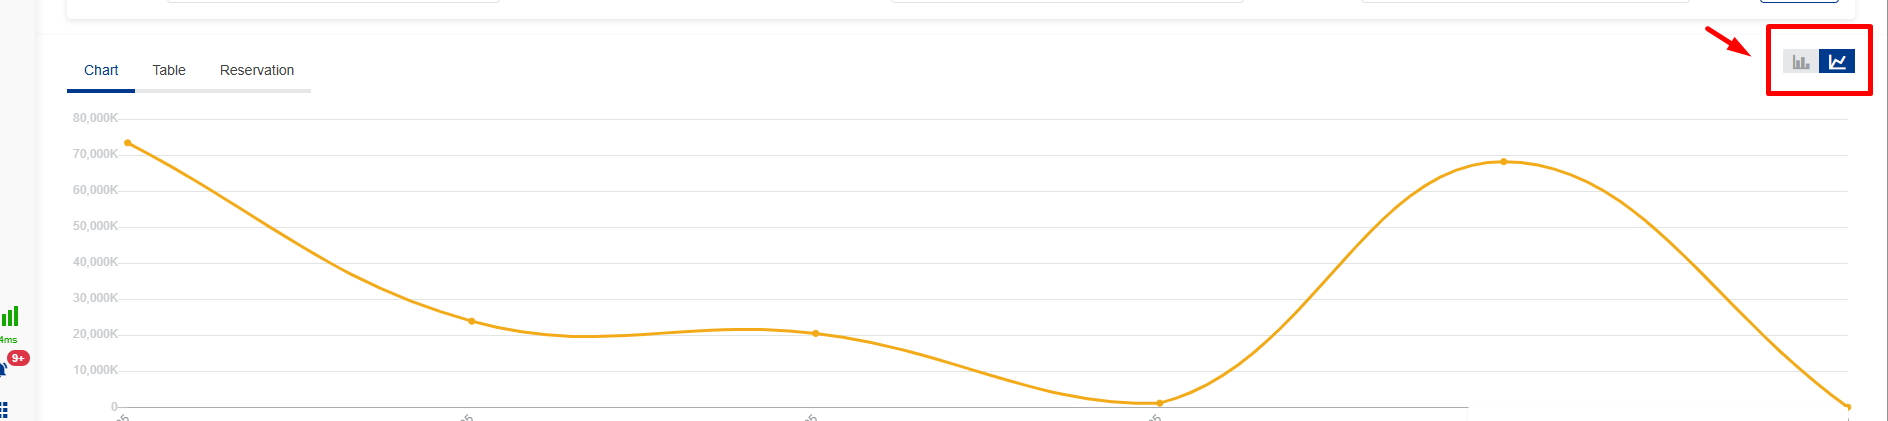
d. Report By:Choose the basis of your report, such as Booking Date, Arrival Date, Departure Date, etc. 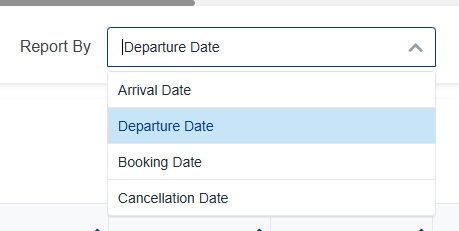 3. Click [Generate] to Create the ReportAfter selecting all the necessary criteria, click the Generate button to create the report. You can view the report in three formats: 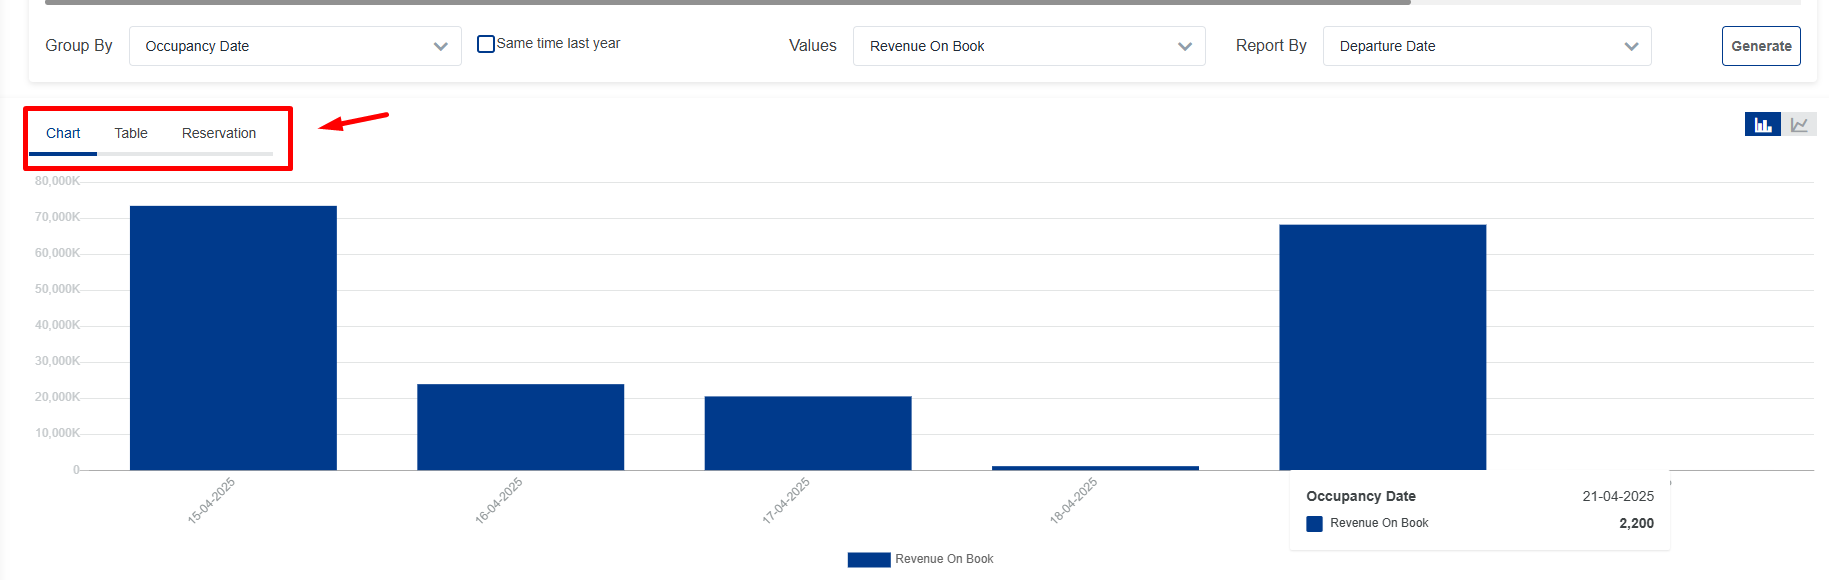 a. Chart View:
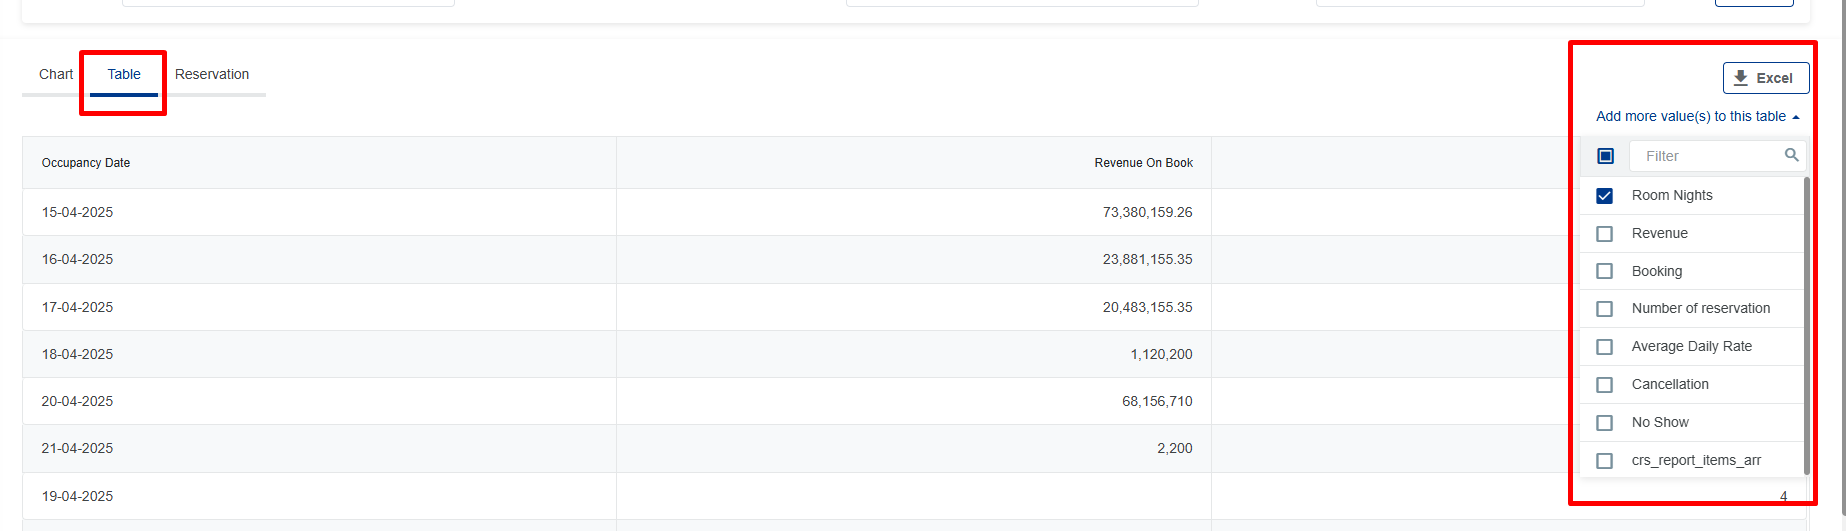
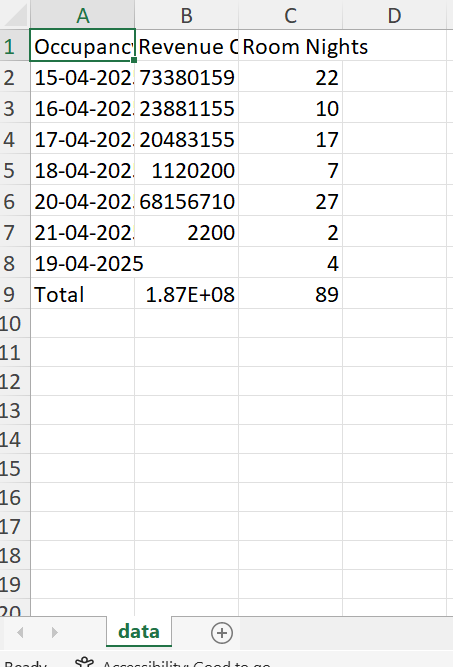
b. Table View:
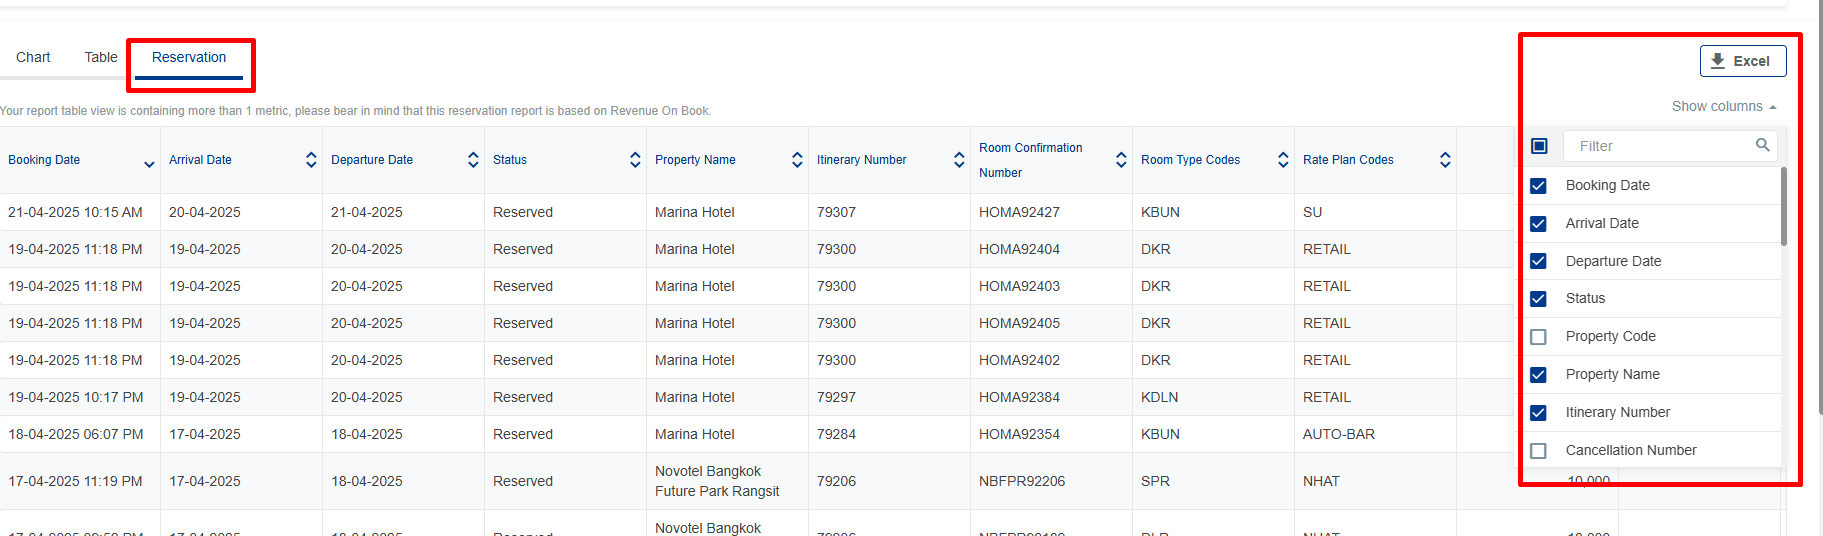
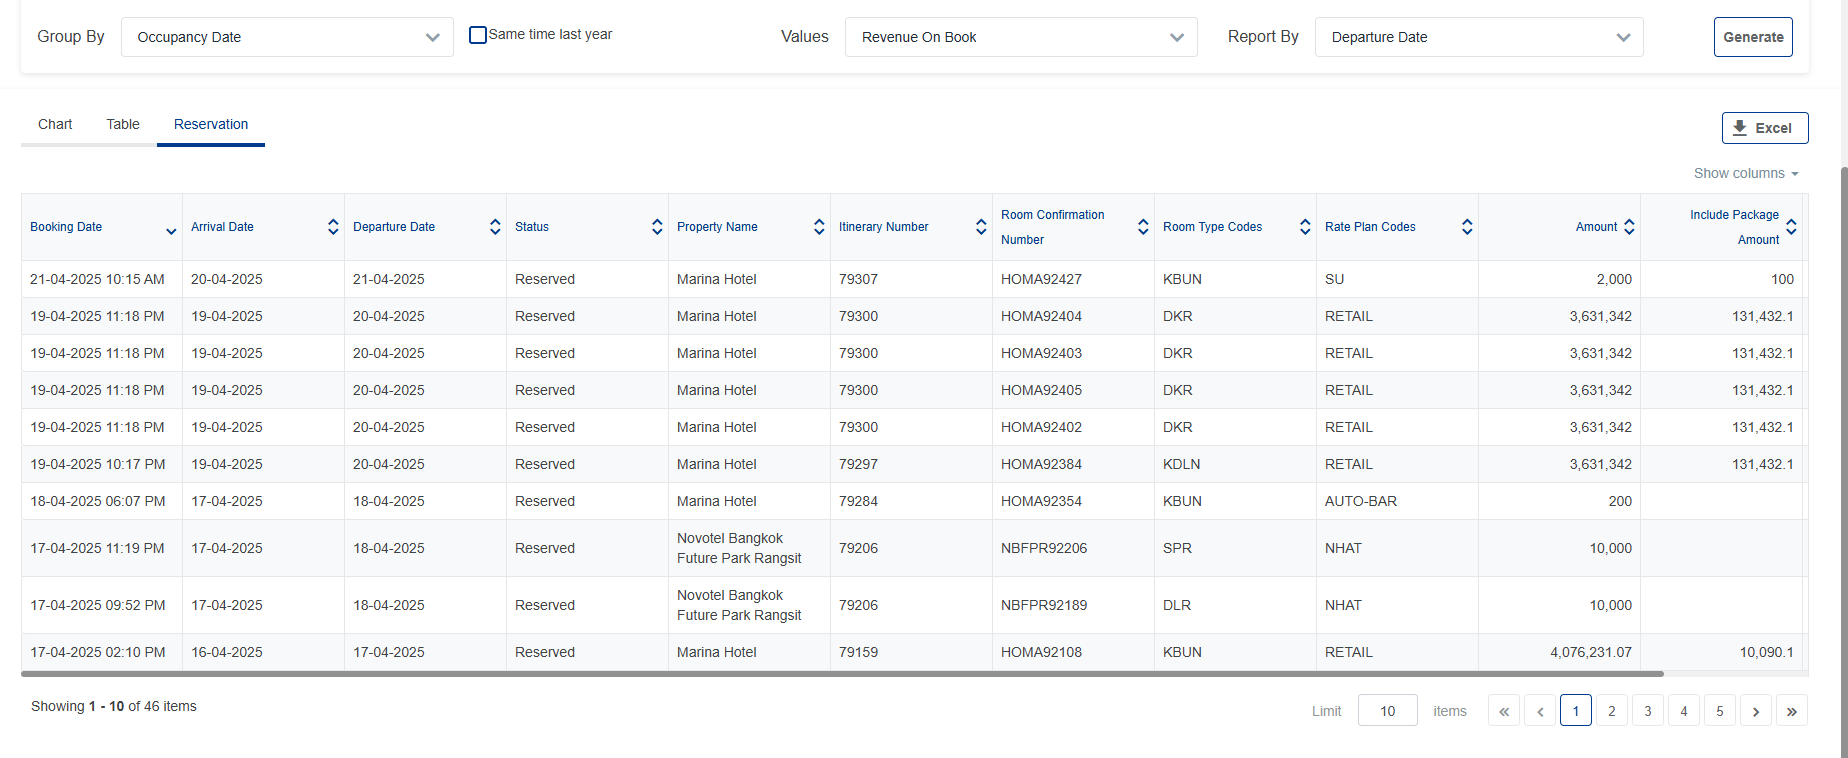
  c. Booking List:
|
Remarks |
|