[Eng] CRS Dashboard

Screen Name

Dashboard

Log in – CRS – Dashboard

Summary

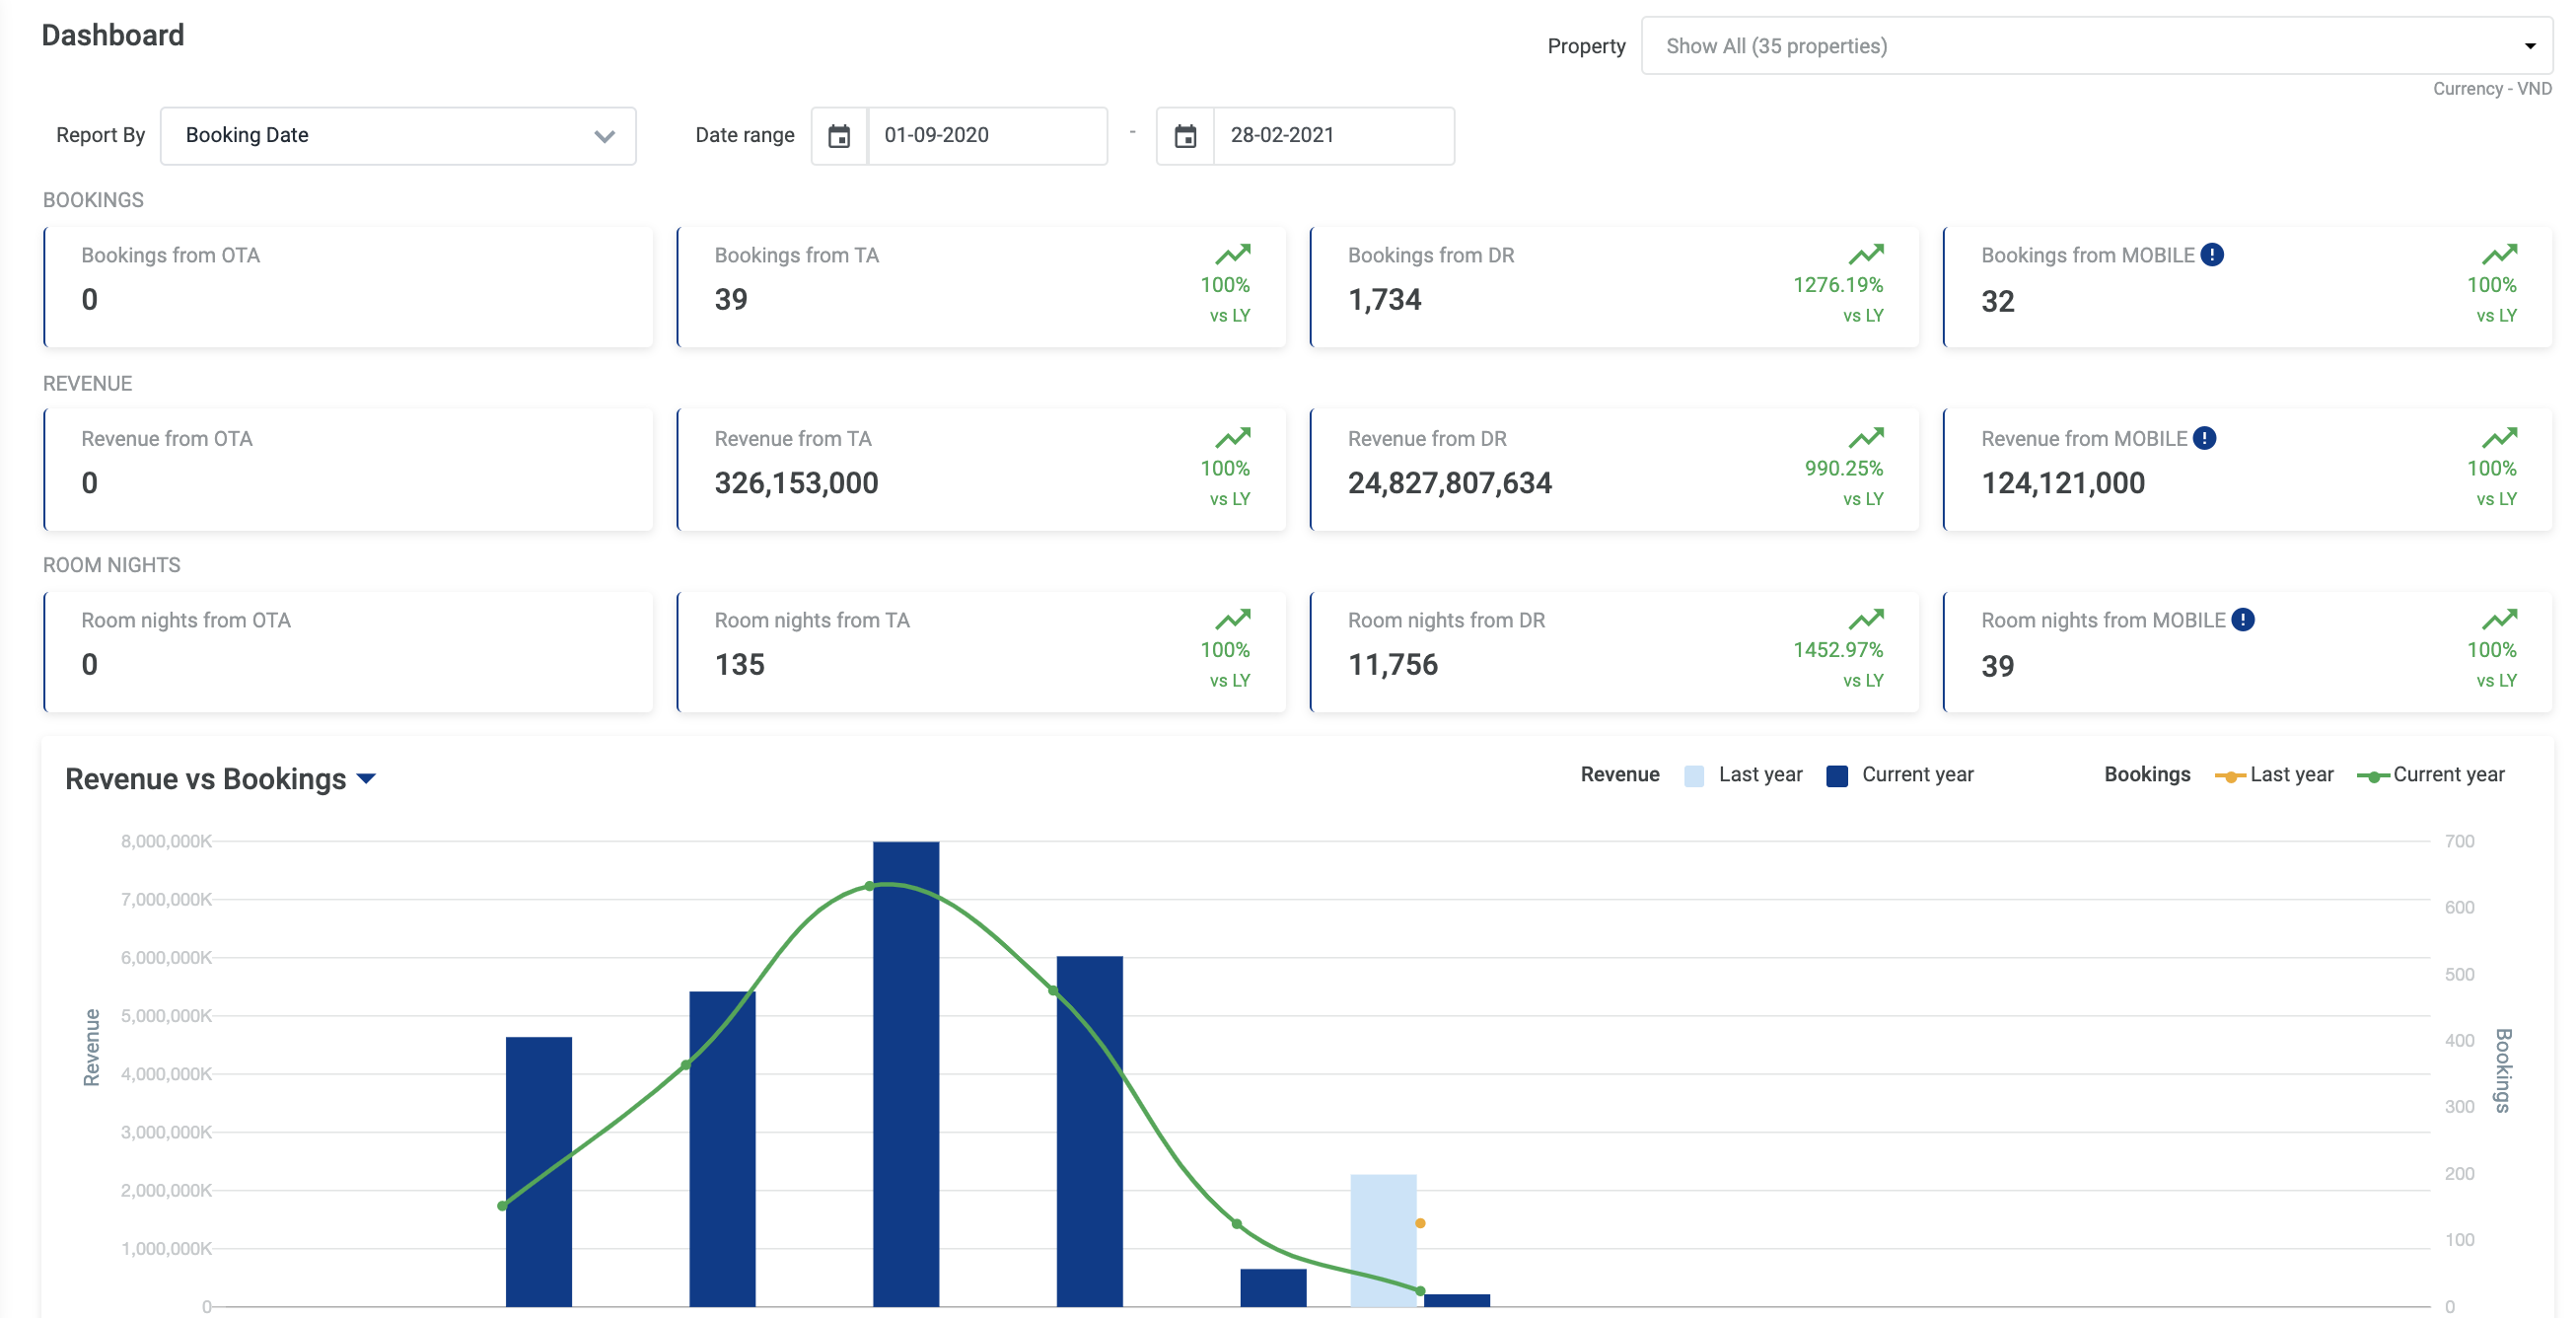
Screen

image-20210426-000717.png
image-20210426-000731.png

Fields Description

Filters

  • Report By

    • Booking Date

    • Arrival Date

    • Departure Date

  • Date Range: Range of date, default is last 30 days

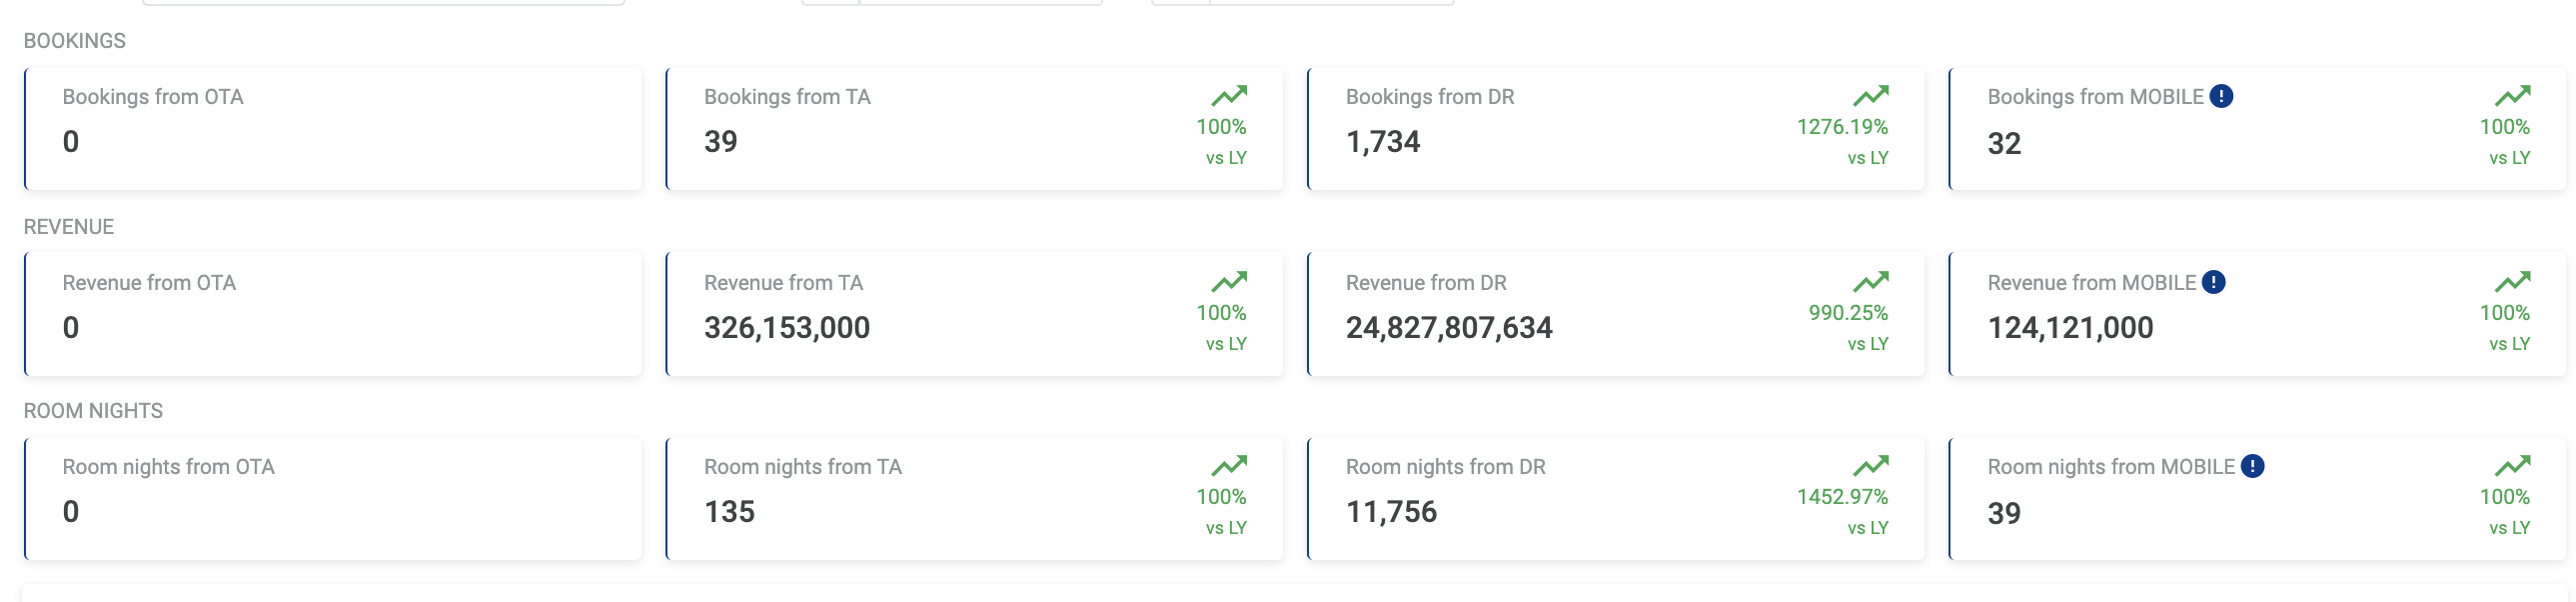
Overview

  • image-20210426-000846.png

    Bookings

  • Revenue

  • Room Nights

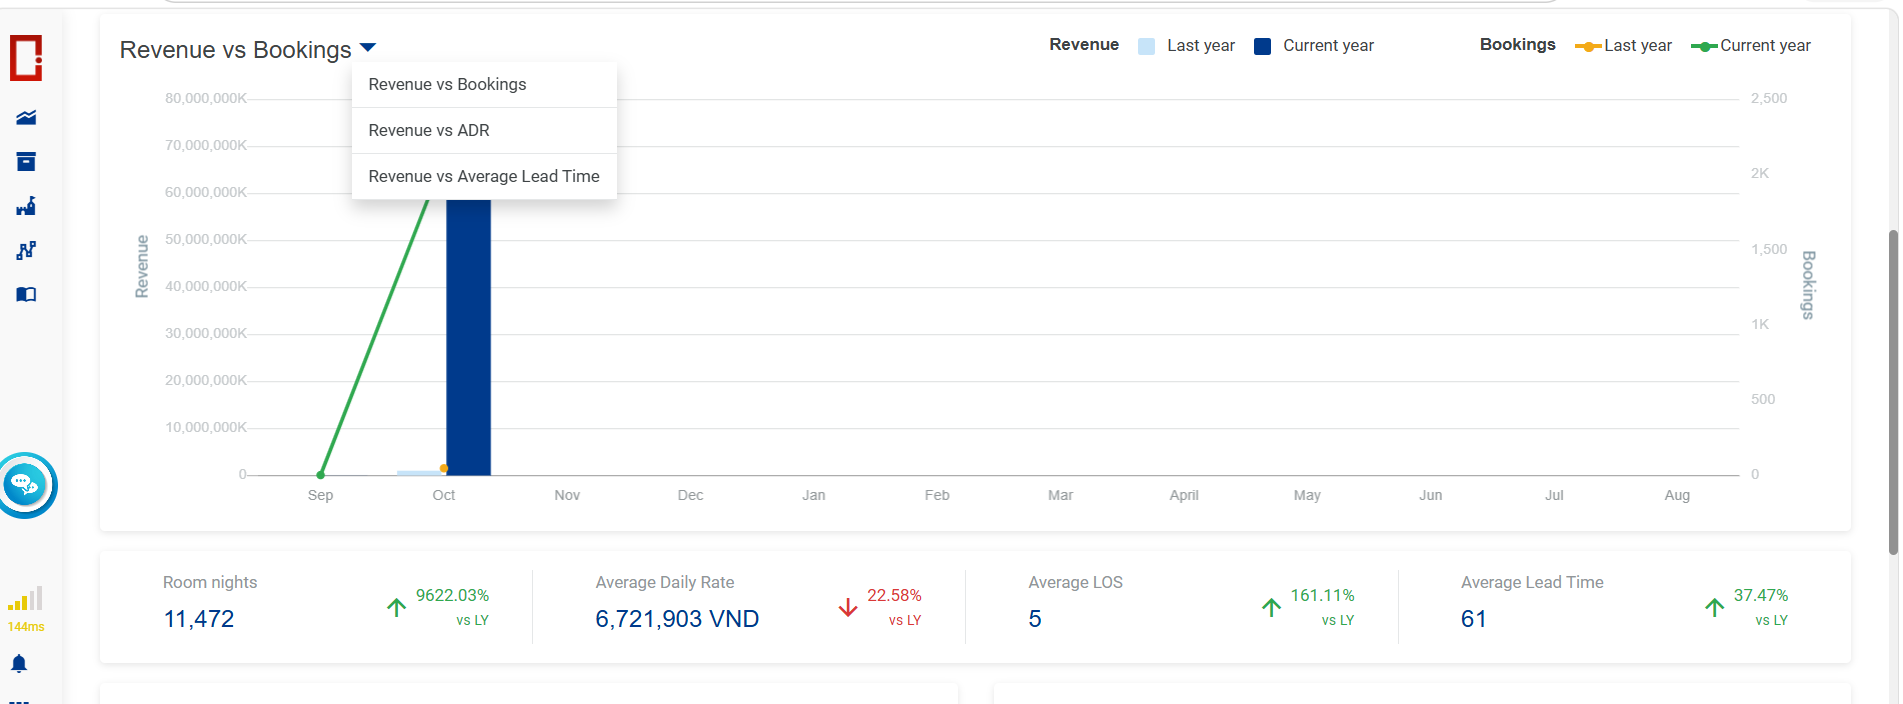
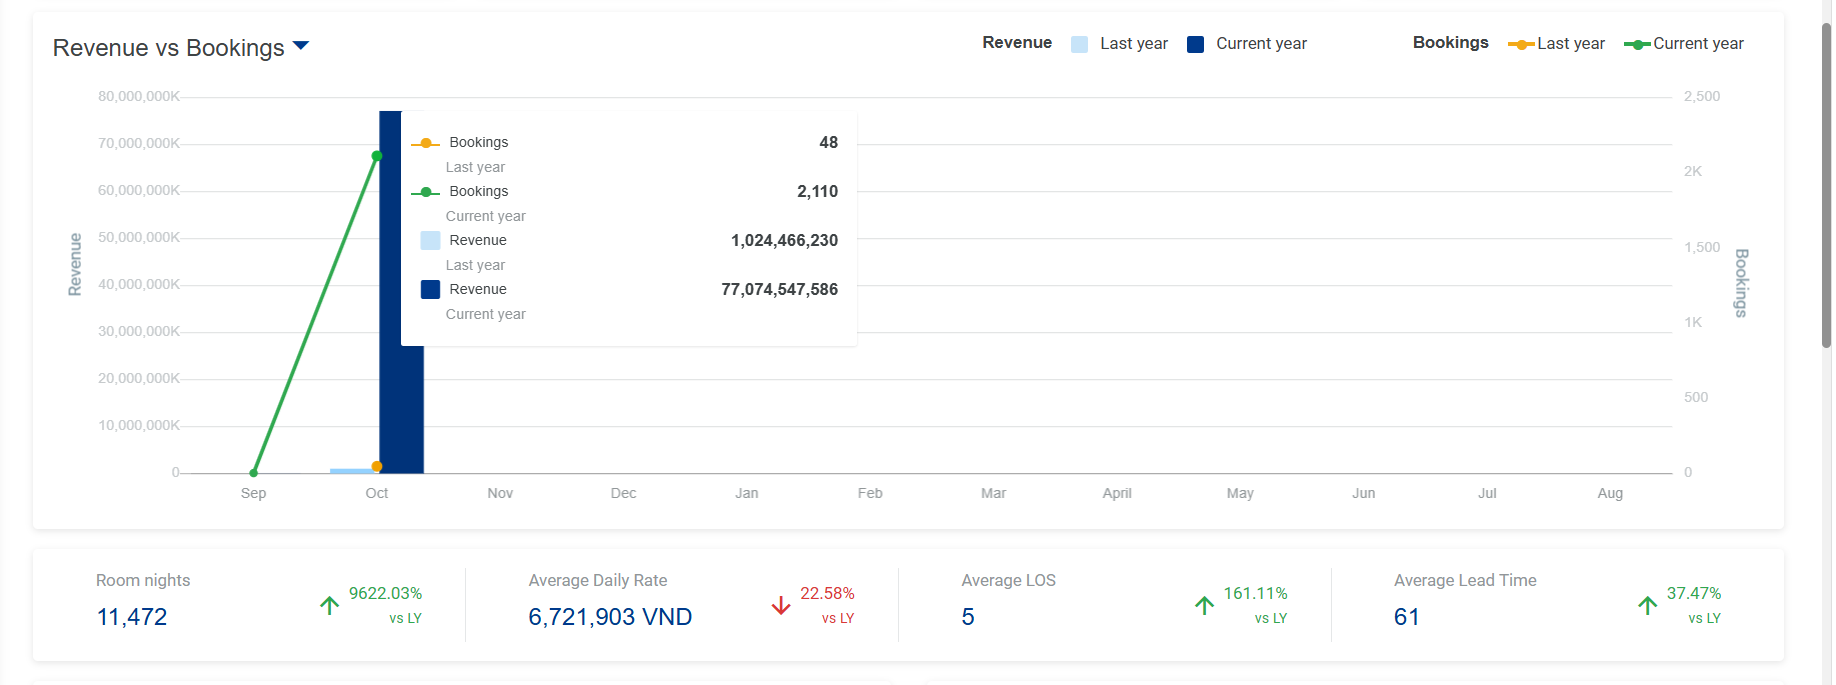
    Revenue Comparison Charts

    image-20261025-121213.png
    image-20261025-121320.png
  • Users can view and compare revenue between the current year and the previous year. Hover over the chart to display detailed figures.

    • Revenue vs. Bookings

    • Revenue vs. ADR (Average Daily Rate)

    • Revenue vs. Average Lead Time


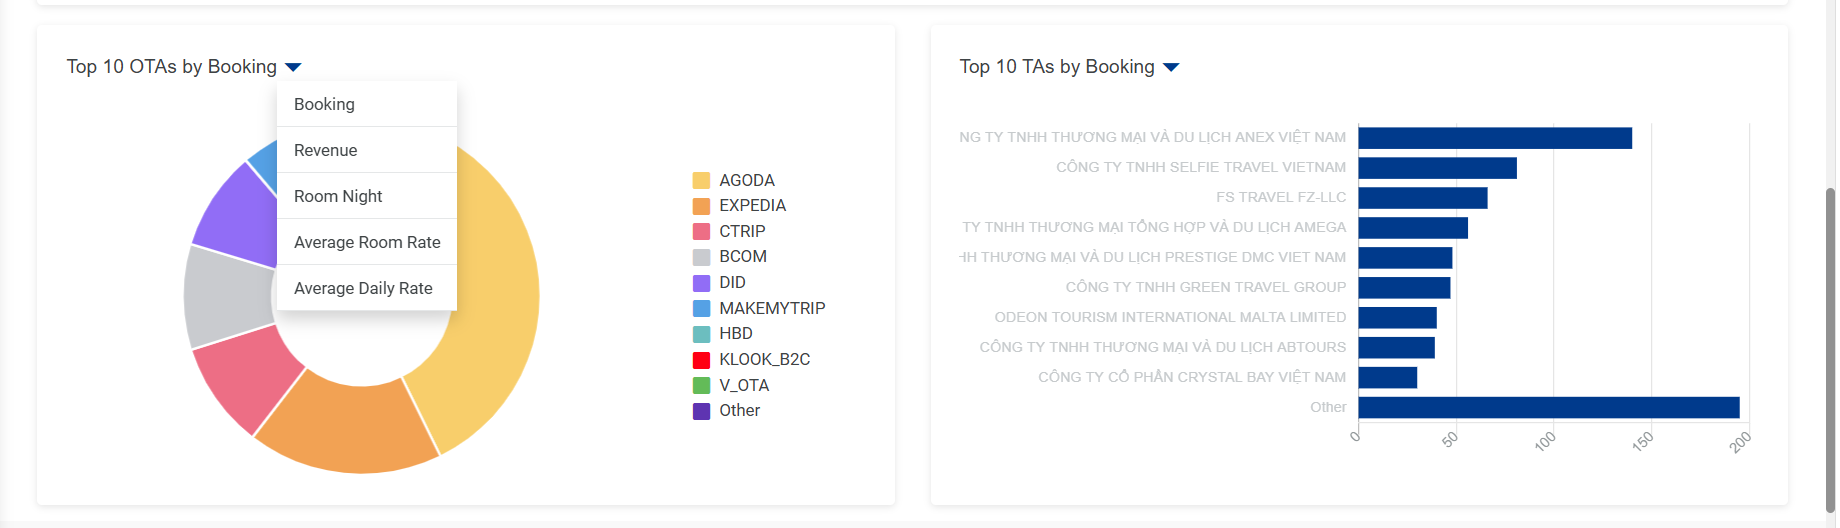
      Top 10 OTA/TA Performance Charts

      image-20261025-121356.png


Users can view charts showing the Top 10 OTA/TA performance. Hover over the chart to display detailed figures.

  • By Bookings

  • By Revenue

  • By Room Nights

  • Average Room Rate

  • Average Daily Rate

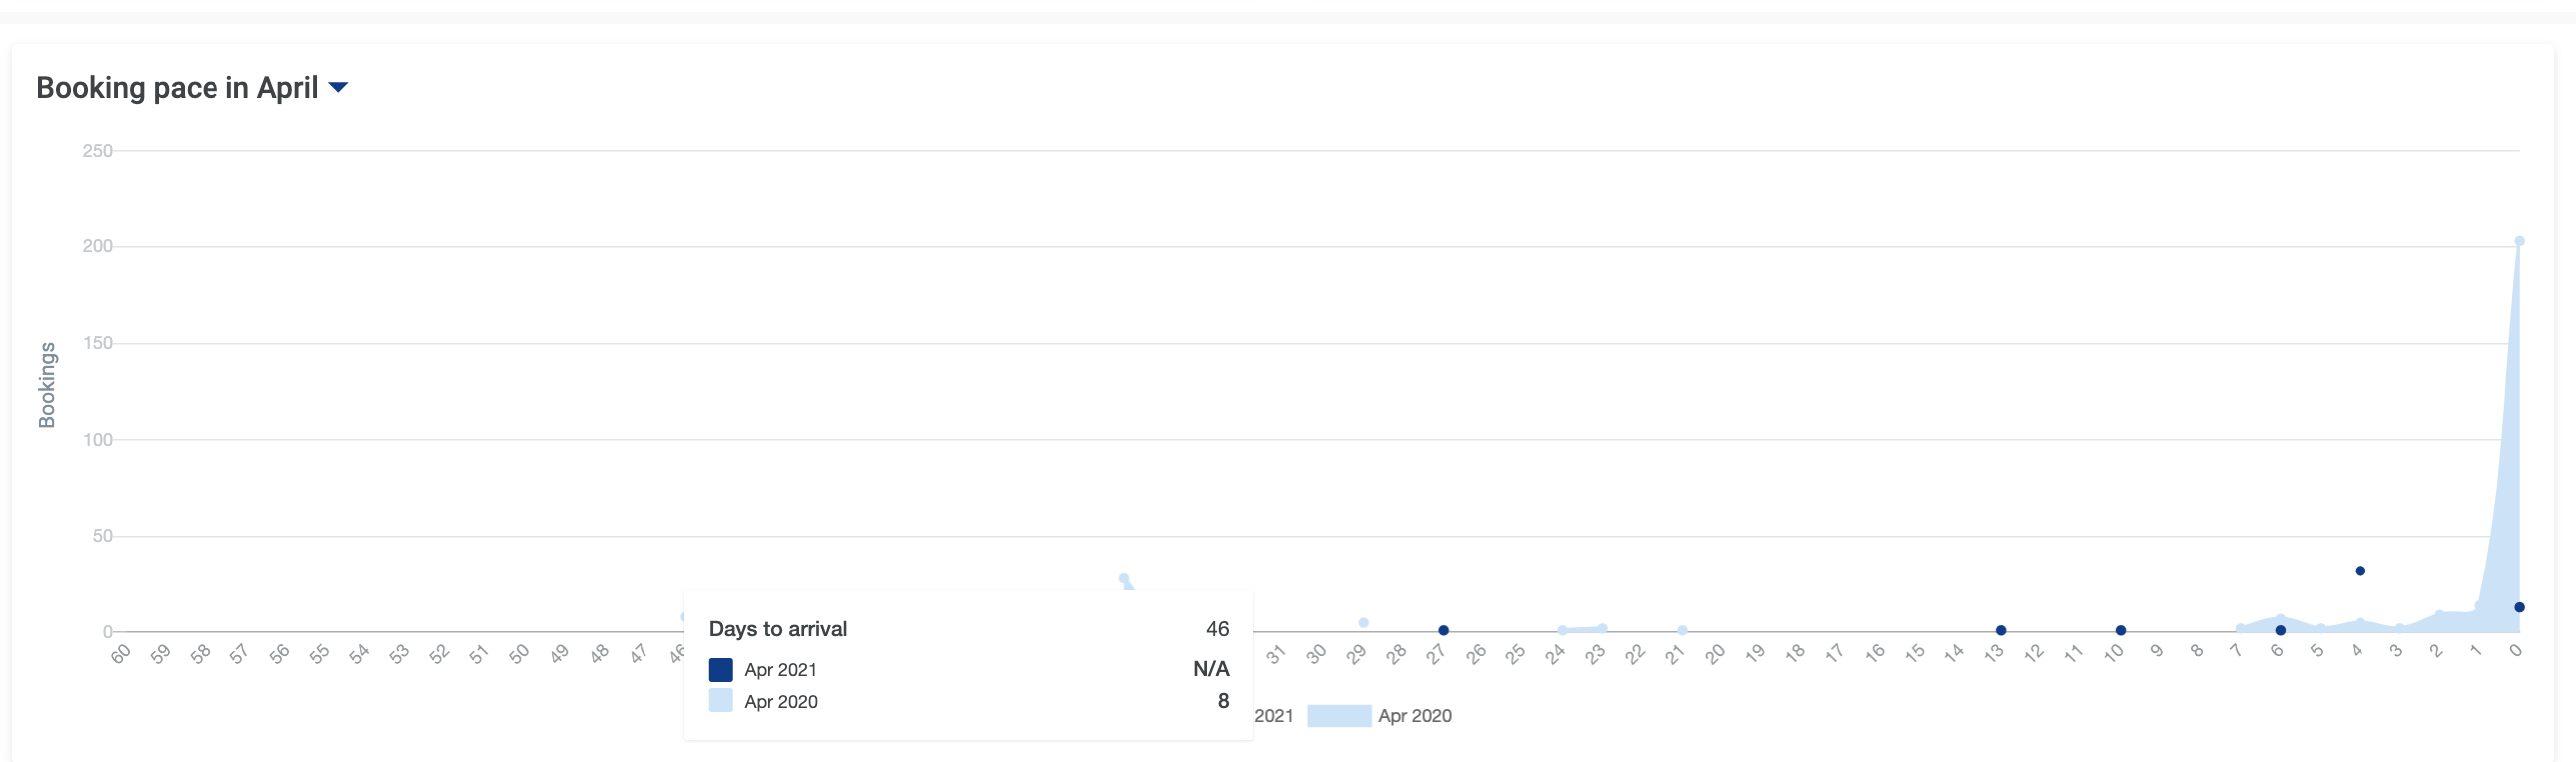
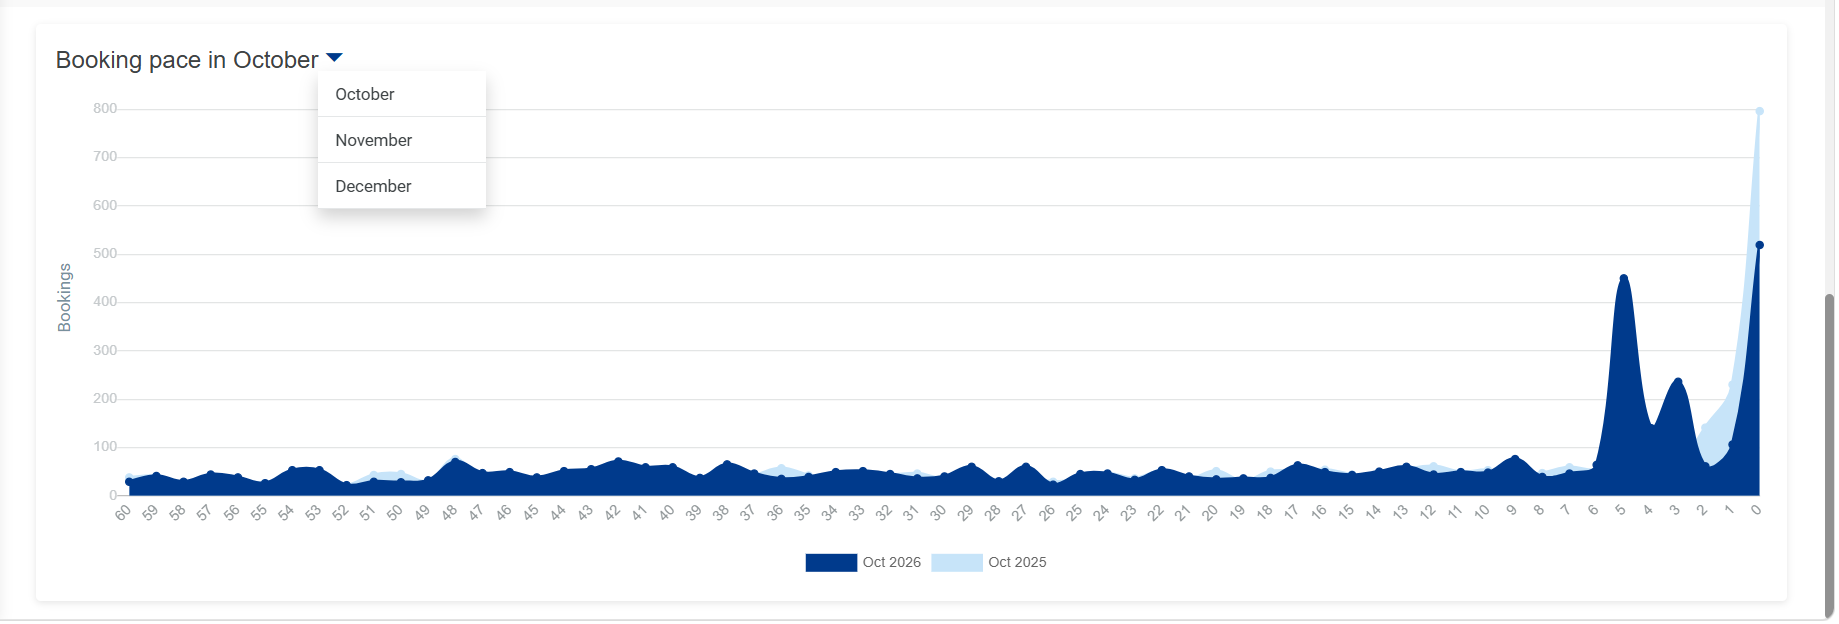
    Boooking Pace

    image-20261025-121446.png


Users can view booking pace statistics for the next three months and compare them with the previous year's data. Hover over the chart to display detailed figures

Remarks

N/A